How prevalent are internal exclusions?
Our unique data analysis uses anonymised, aggregate data collected by schools using Arbor to shine a light on how many pupils are internally excluded (removed from a lesson) each year.
Setting the scene
Externally excluding a pupil is not something any school takes lightly. Whether it’s a permanent exclusion, or a temporary one, schools have robust processes in place to ensure exclusion is a last resort for when something has gone seriously wrong.
For context, the rate of temporary exclusions (or “suspensions”) per 100 students was 4.02 in the DfE’s figures from the autumn term 2024/25, the latest for which data is available. And for permanent exclusions, it was 0.04. While this data shows a slight improvement on the same period in 2023/24 (suspensions were down from 4.13; permanent exclusions were down from 0.05), that previous period had the highest rates on record.
Recently, schools have been encouraged to do much more to prevent external exclusions, with the DfE announcing in July that it was looking for partners to build a toolkit to help schools here. One option schools have in reducing the number of suspensions or permanent exclusions they issue is to use “internal exclusions”. In other words, the pupil is excluded from lessons, but they are not excluded from the school itself.
The challenge for policy-makers is that they don’t have a sense of how much of this is happening in schools across the country, because while they need to be on top of their own data, they are not required to report it to the DfE.
So when we were recently asked by Schools Week to analyse anonymised, aggregate data in Arbor, to get a sense of the scale of internal exclusions, we were both curious and up for the challenge, while being mindful that the data is imperfect.
Our approach
Before we looked into it, we discounted the “COVID” years of 2020/21 and 2021/22, when pupils spent so much time off the premises, and where the introduction of “bubbles” would have made internal exclusions a much more challenging proposition for senior leadership teams to manage. We also discounted data from the current academic year, because we were only a term in.
So, we’ve looked at the previous three full academic years, from 2022/23 to 2024/25.
We also only looked at schools that had recorded at least one internal exclusion each year - which, for secondaries, in our sample of 1,195 schools, was 64% last year, and for primaries, in our sample of 8,548 schools, was 5%. This meant we could be confident that this was data they even recorded on their MIS. (It is possible that other schools use internal exclusions but don’t record the data in the way we expected.)
And it goes without saying that there are other things for us to think about when analysing this data. Schools and teachers may have seen a shift in the way they record data over the past few years - for example a change in their policy might mean a shift in the way they log incidents, or a change in MIS provider might cause them to review how they categorise their data.
Bearing this in mind, we have to read this data with caution - but still, we think it’s the first time it’s been done, and that it's a useful benchmark for schools to compare their own data to. The data is not weighted, and in the last academic year (2024/25) we had a much higher number of schools (1,253) than in the first year we studied (2022/23 - when there were 603 schools). However overall we have looked at more than a million pupils in the most recent year - that’s a significant sample to work with.
Secondary schools
Internal exclusions in secondary schools that recorded at least one incident in Arbor, look like this:
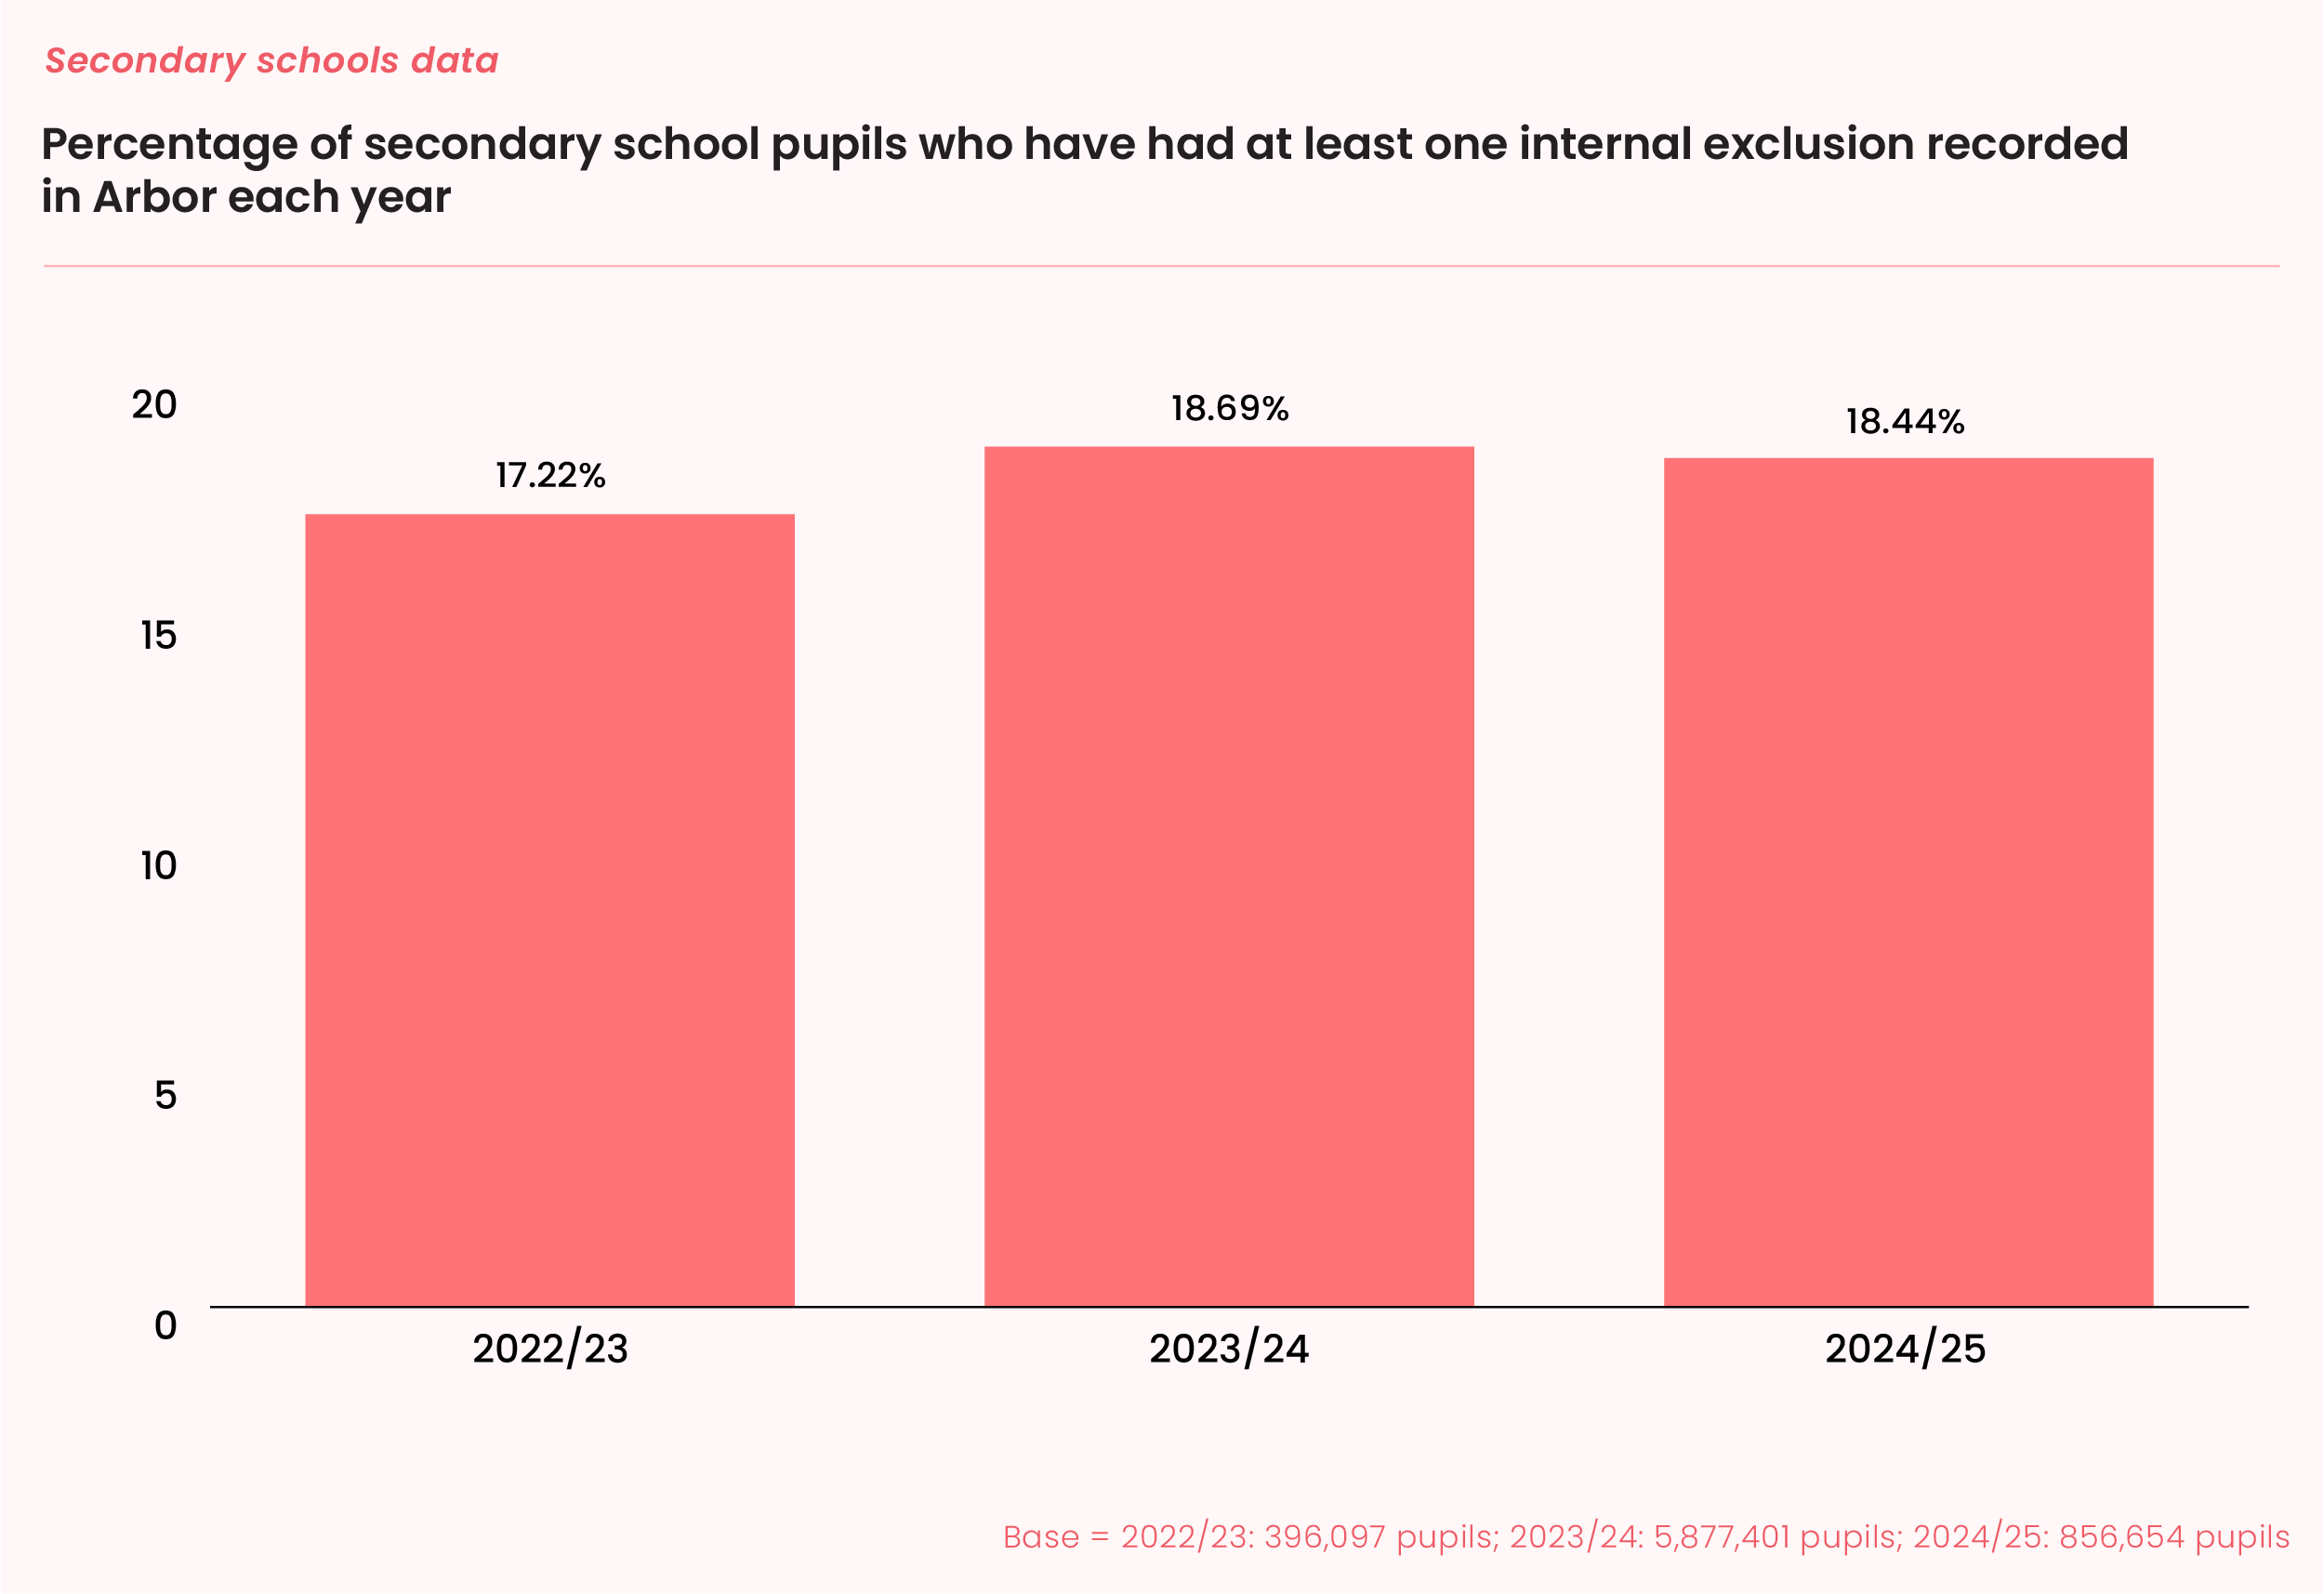
As we can see, there’s little variation across the years, with the most recent year (2024/25) seeing over 18% of pupils experiencing at least one internal exclusion that year. There will of course be huge variation between schools, but this data looks broadly similar from one year to the next when taken as an average.
We can also show this data by the rate of internal exclusions - how many exclusions per 100 pupils, among schools that have recorded at least one:
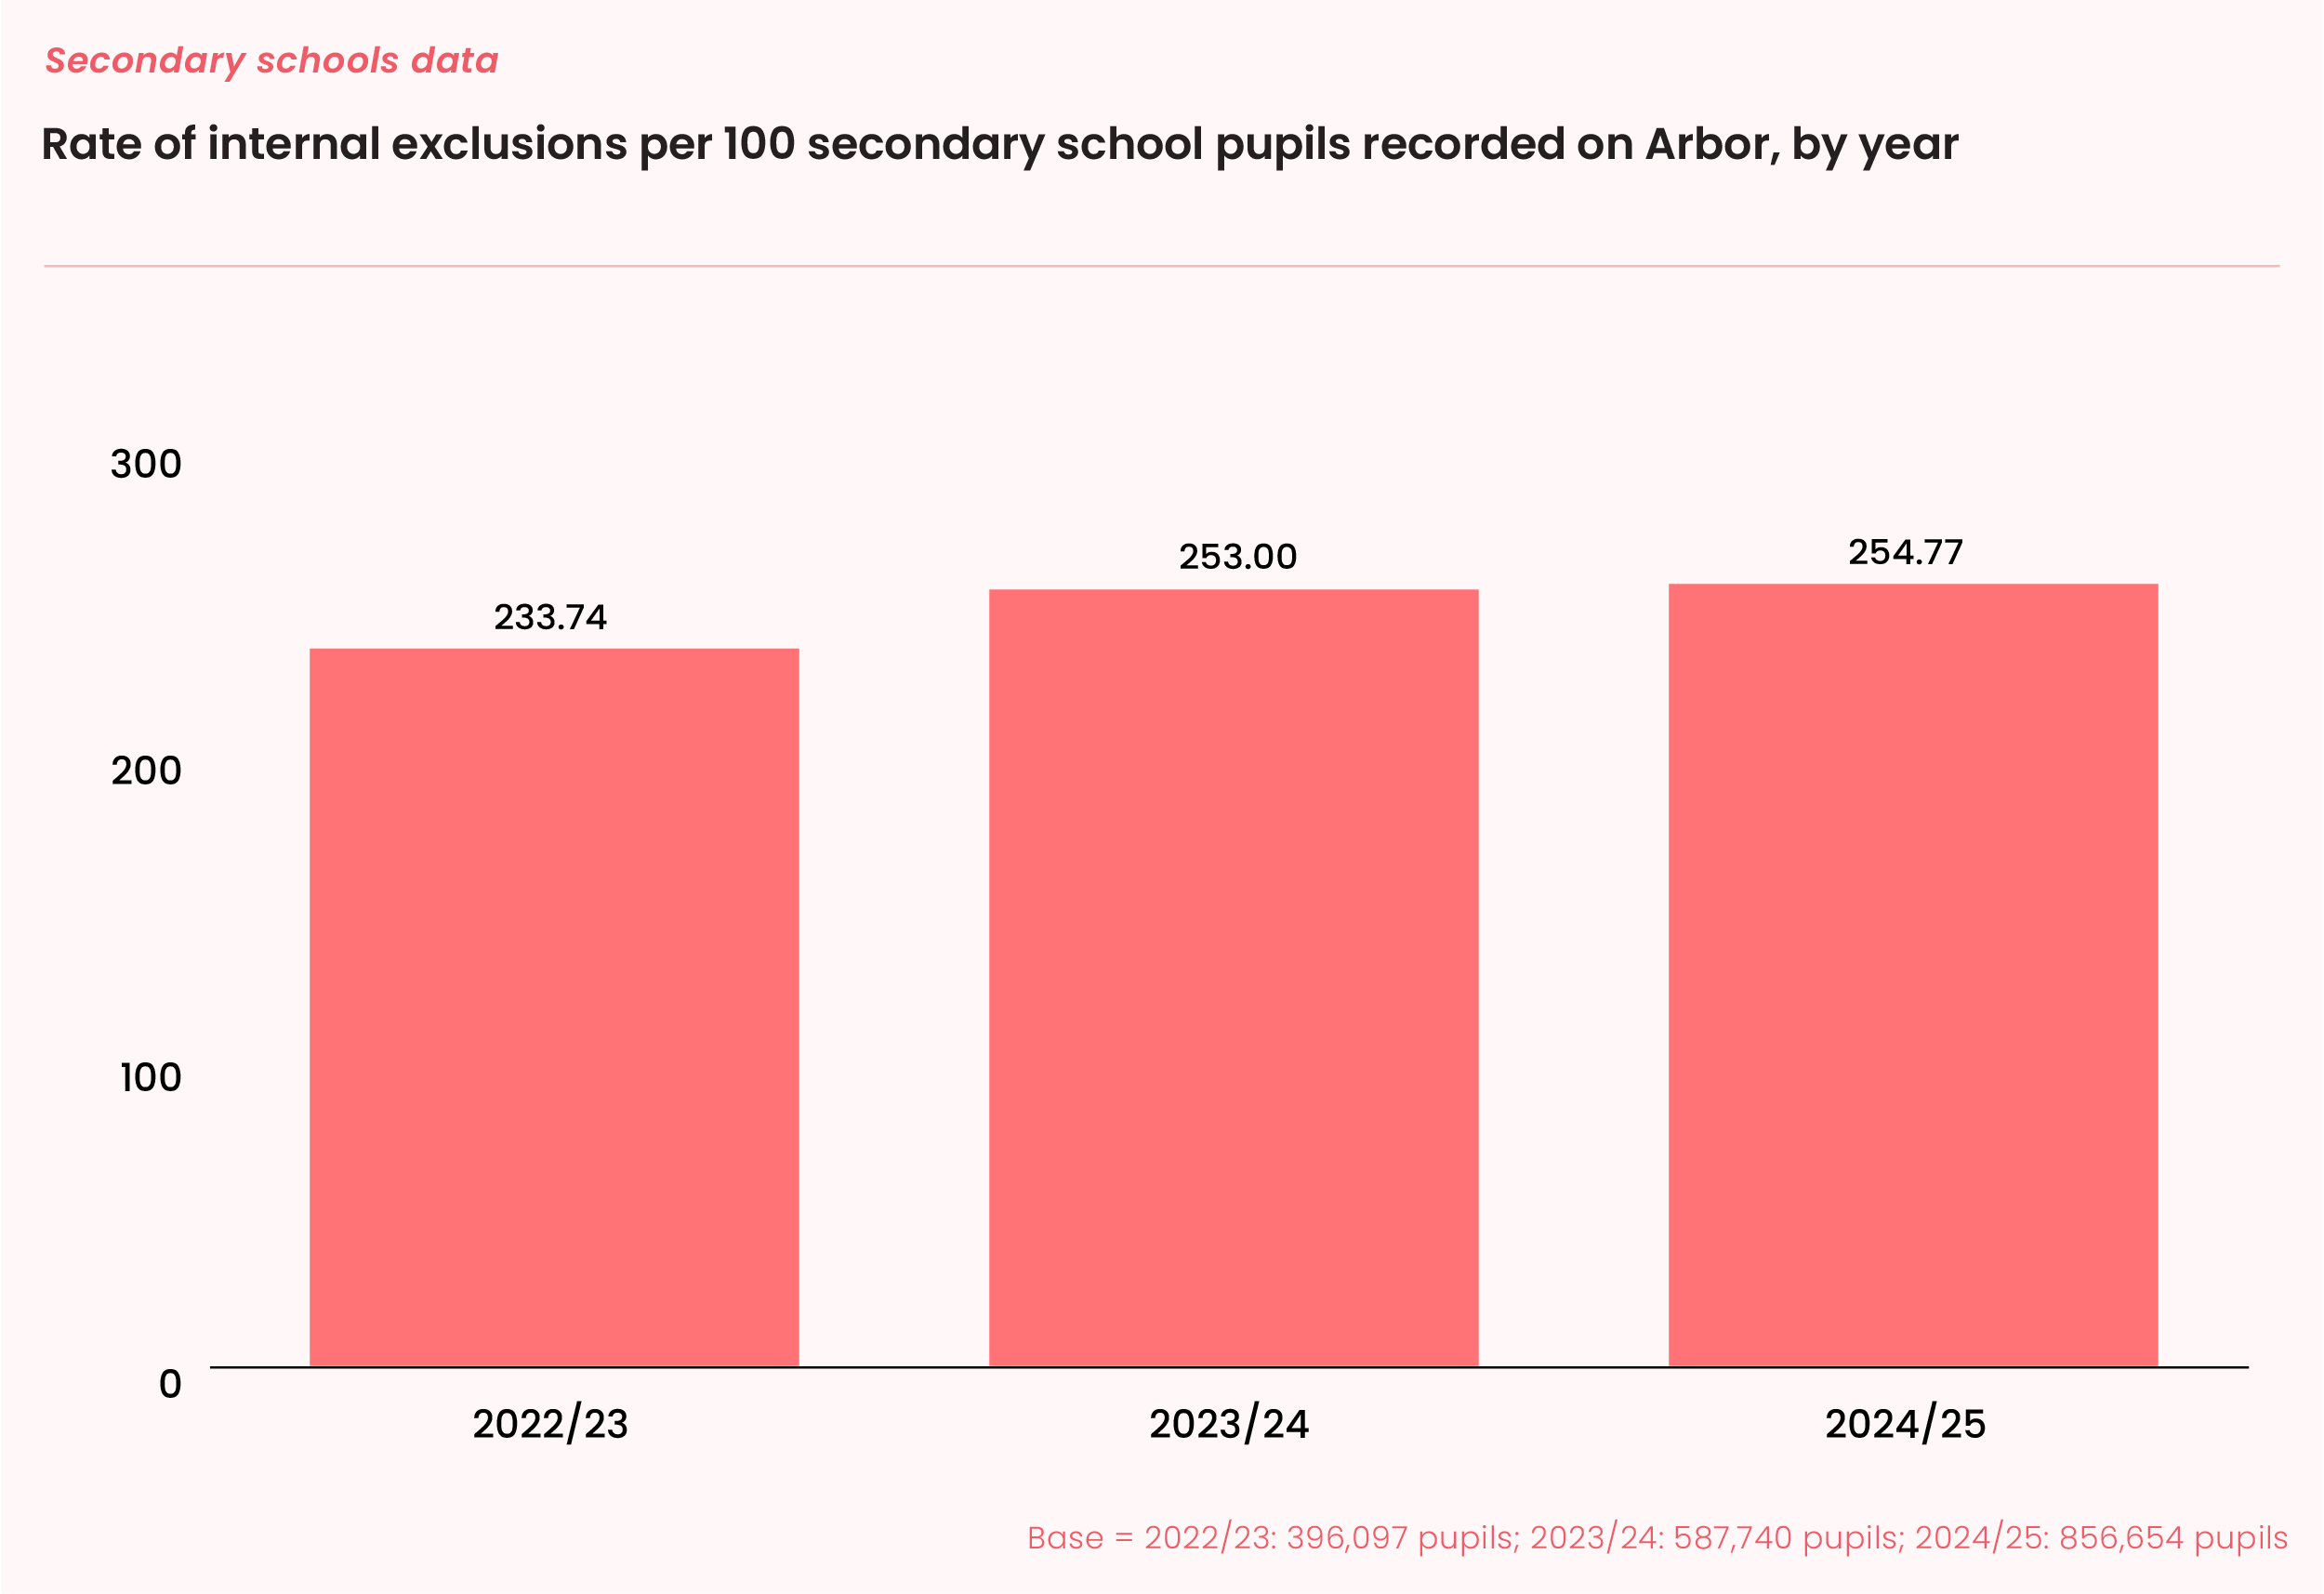
Again, very little difference between the years, which gives reassurance that this data is not subject to huge changes in teacher behaviour when inputting the data, caused by a change of system or data policy.
We can then split this out by local authority schools and academies (note that we labelled this data as “secondary MAT”, and the vast majority will be in a MAT, but some single academy trusts will be included in this data set):
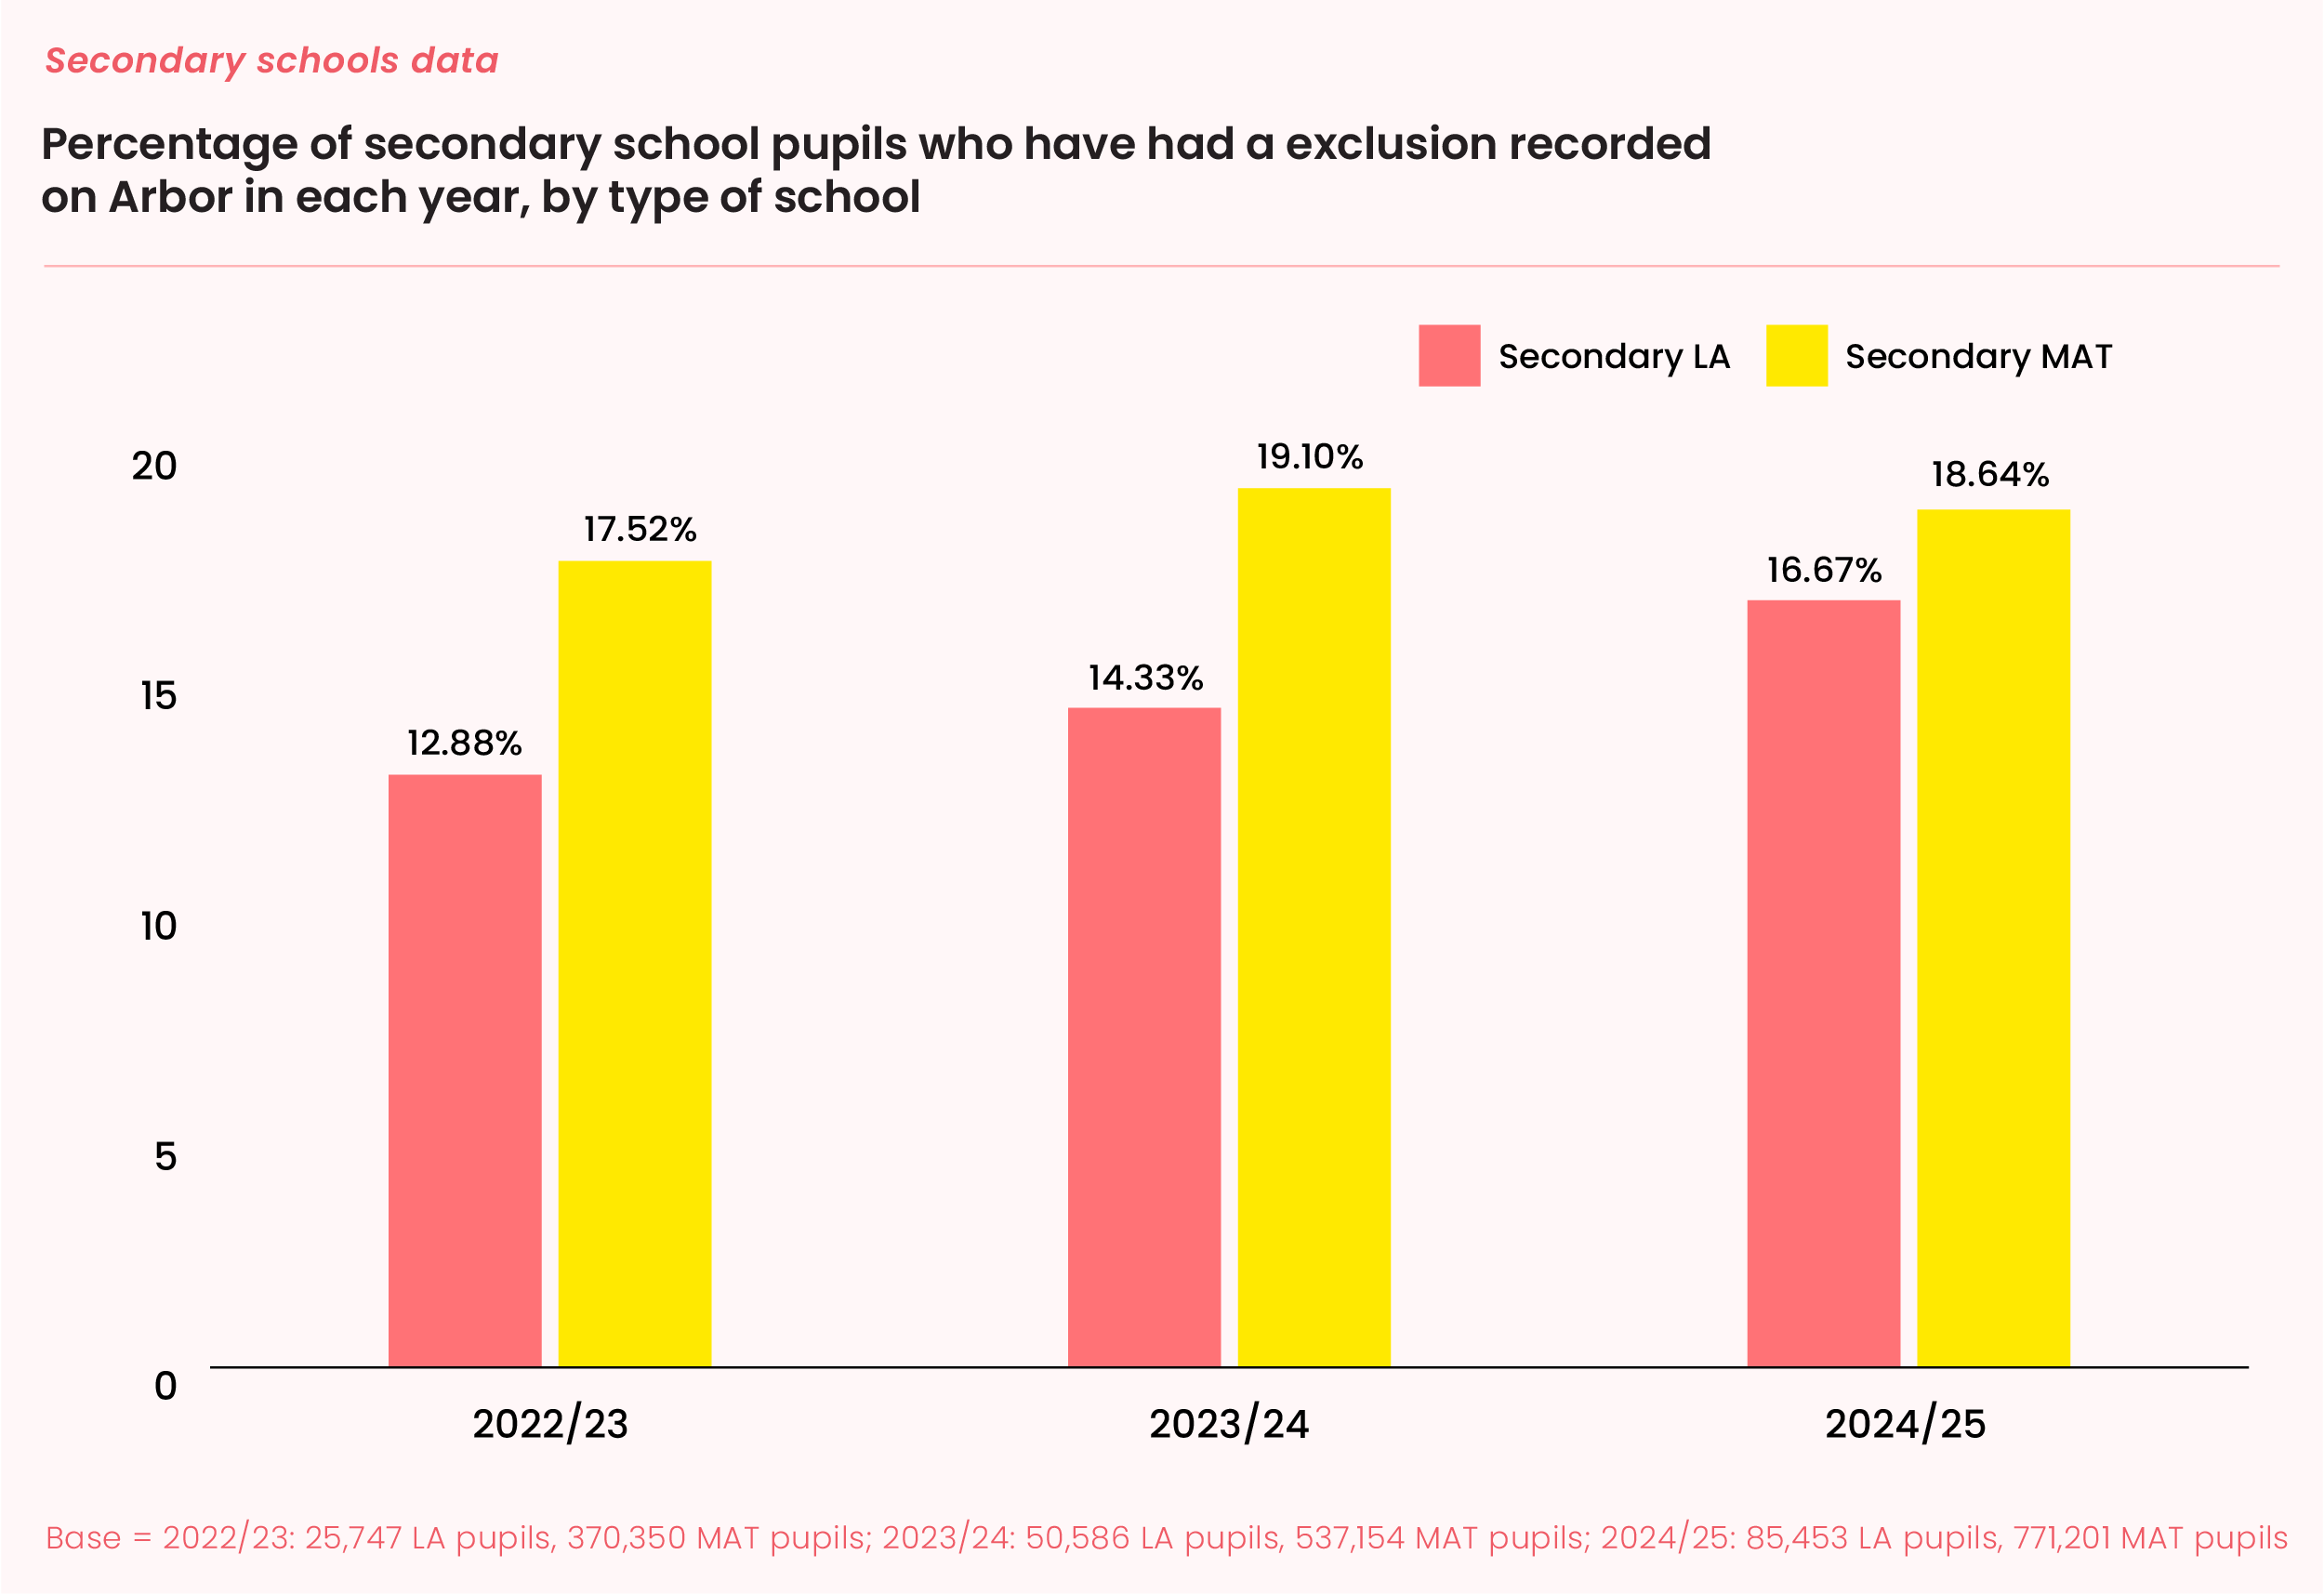
We can see a clear difference between secondary schools accountable to the local authority and those in MATs, but that gap is closing over time - in 2022/23 we see a gap of 4.64 percentage points, which drops to 1.97 in 2024/25. It’s hard to know why this gap has narrowed, but it’s also interesting to see that among secondaries in MATs, the percentage dropped between 2023/24 and 2024/25. Could this be a change in MAT-wide policy or improved pupil behaviour?
Again, we can look at the rate of internal exclusions, but by type of secondary school:
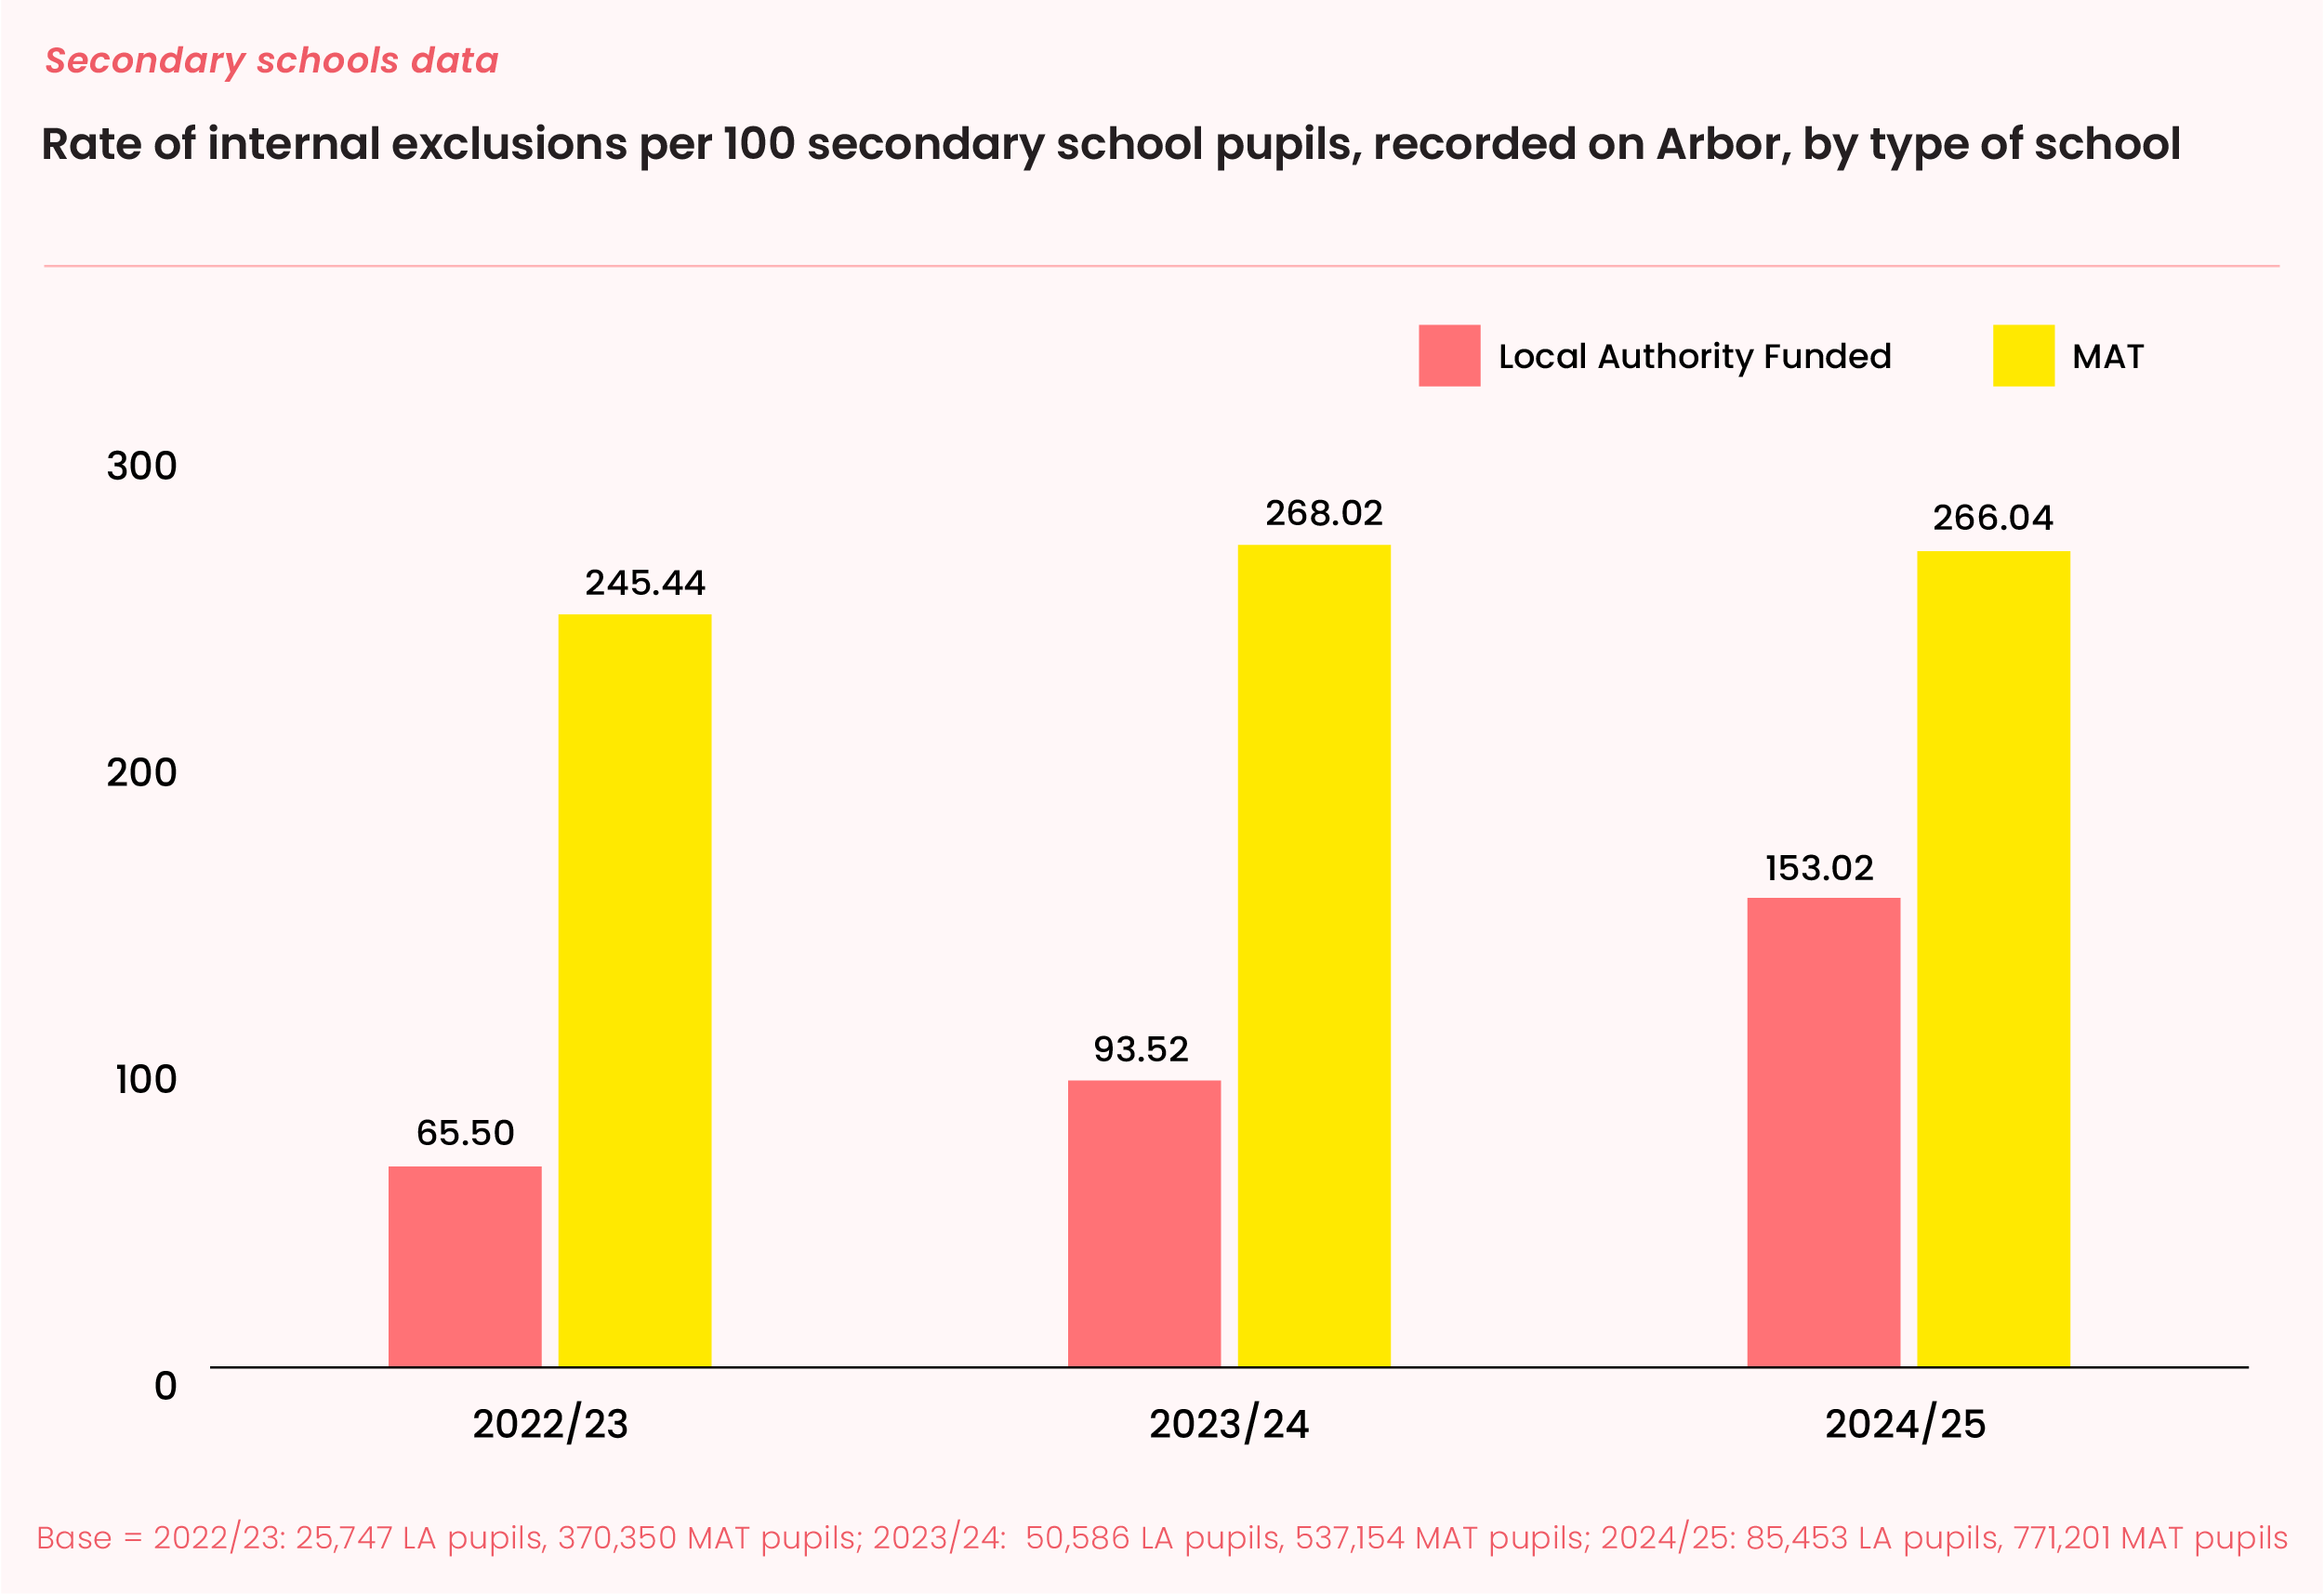
Here we see a much more balanced data set among the schools in MATs across the years - although the rate is considerably higher than in LA funded schools. It will be interesting to see if the rate of internal exclusions in LA schools continues to climb on the same trajectory over the next few years, to catch up with their MAT counterparts - and whether MAT schools will continue to plateau.
Primary schools
When it comes to managing behaviour, primary schools are a very different beast to secondaries. Most primary schools are either one or two-form entry, with a few hundred pupils rather than the thousand-odd in the average secondary school. With fewer “non-classroom-based” staff to manage internal exclusions, in the way that a secondary school is highly likely to have a dedicated space to take in pupils, and dedicated staff - it looks very different on the ground. That matters - in an average headteacher or deputy head’s office (anecdotally, the likely home of the internally-excluded primary pupil), there is only so much room, and only so much capacity of the SLT to manage that child, alongside everything else they’re doing. It’s unlikely they’d be able to take multiple pupils at the same time. We might expect to see significantly fewer exclusions as a result of that alone.
And it’s also fair to say that primary pupil behaviour presents very differently to secondary pupil behaviour. While primary schools have seen an uptick in poor behaviour over recent years, the types of behaviour involved are likely to be incomparable with that of secondary pupils - and also, less likely to lead to an internal exclusion, and more likely to lead to an intervention of a pastoral nature, or from the SENCO/ inclusion lead.
Here’s what it looks like:
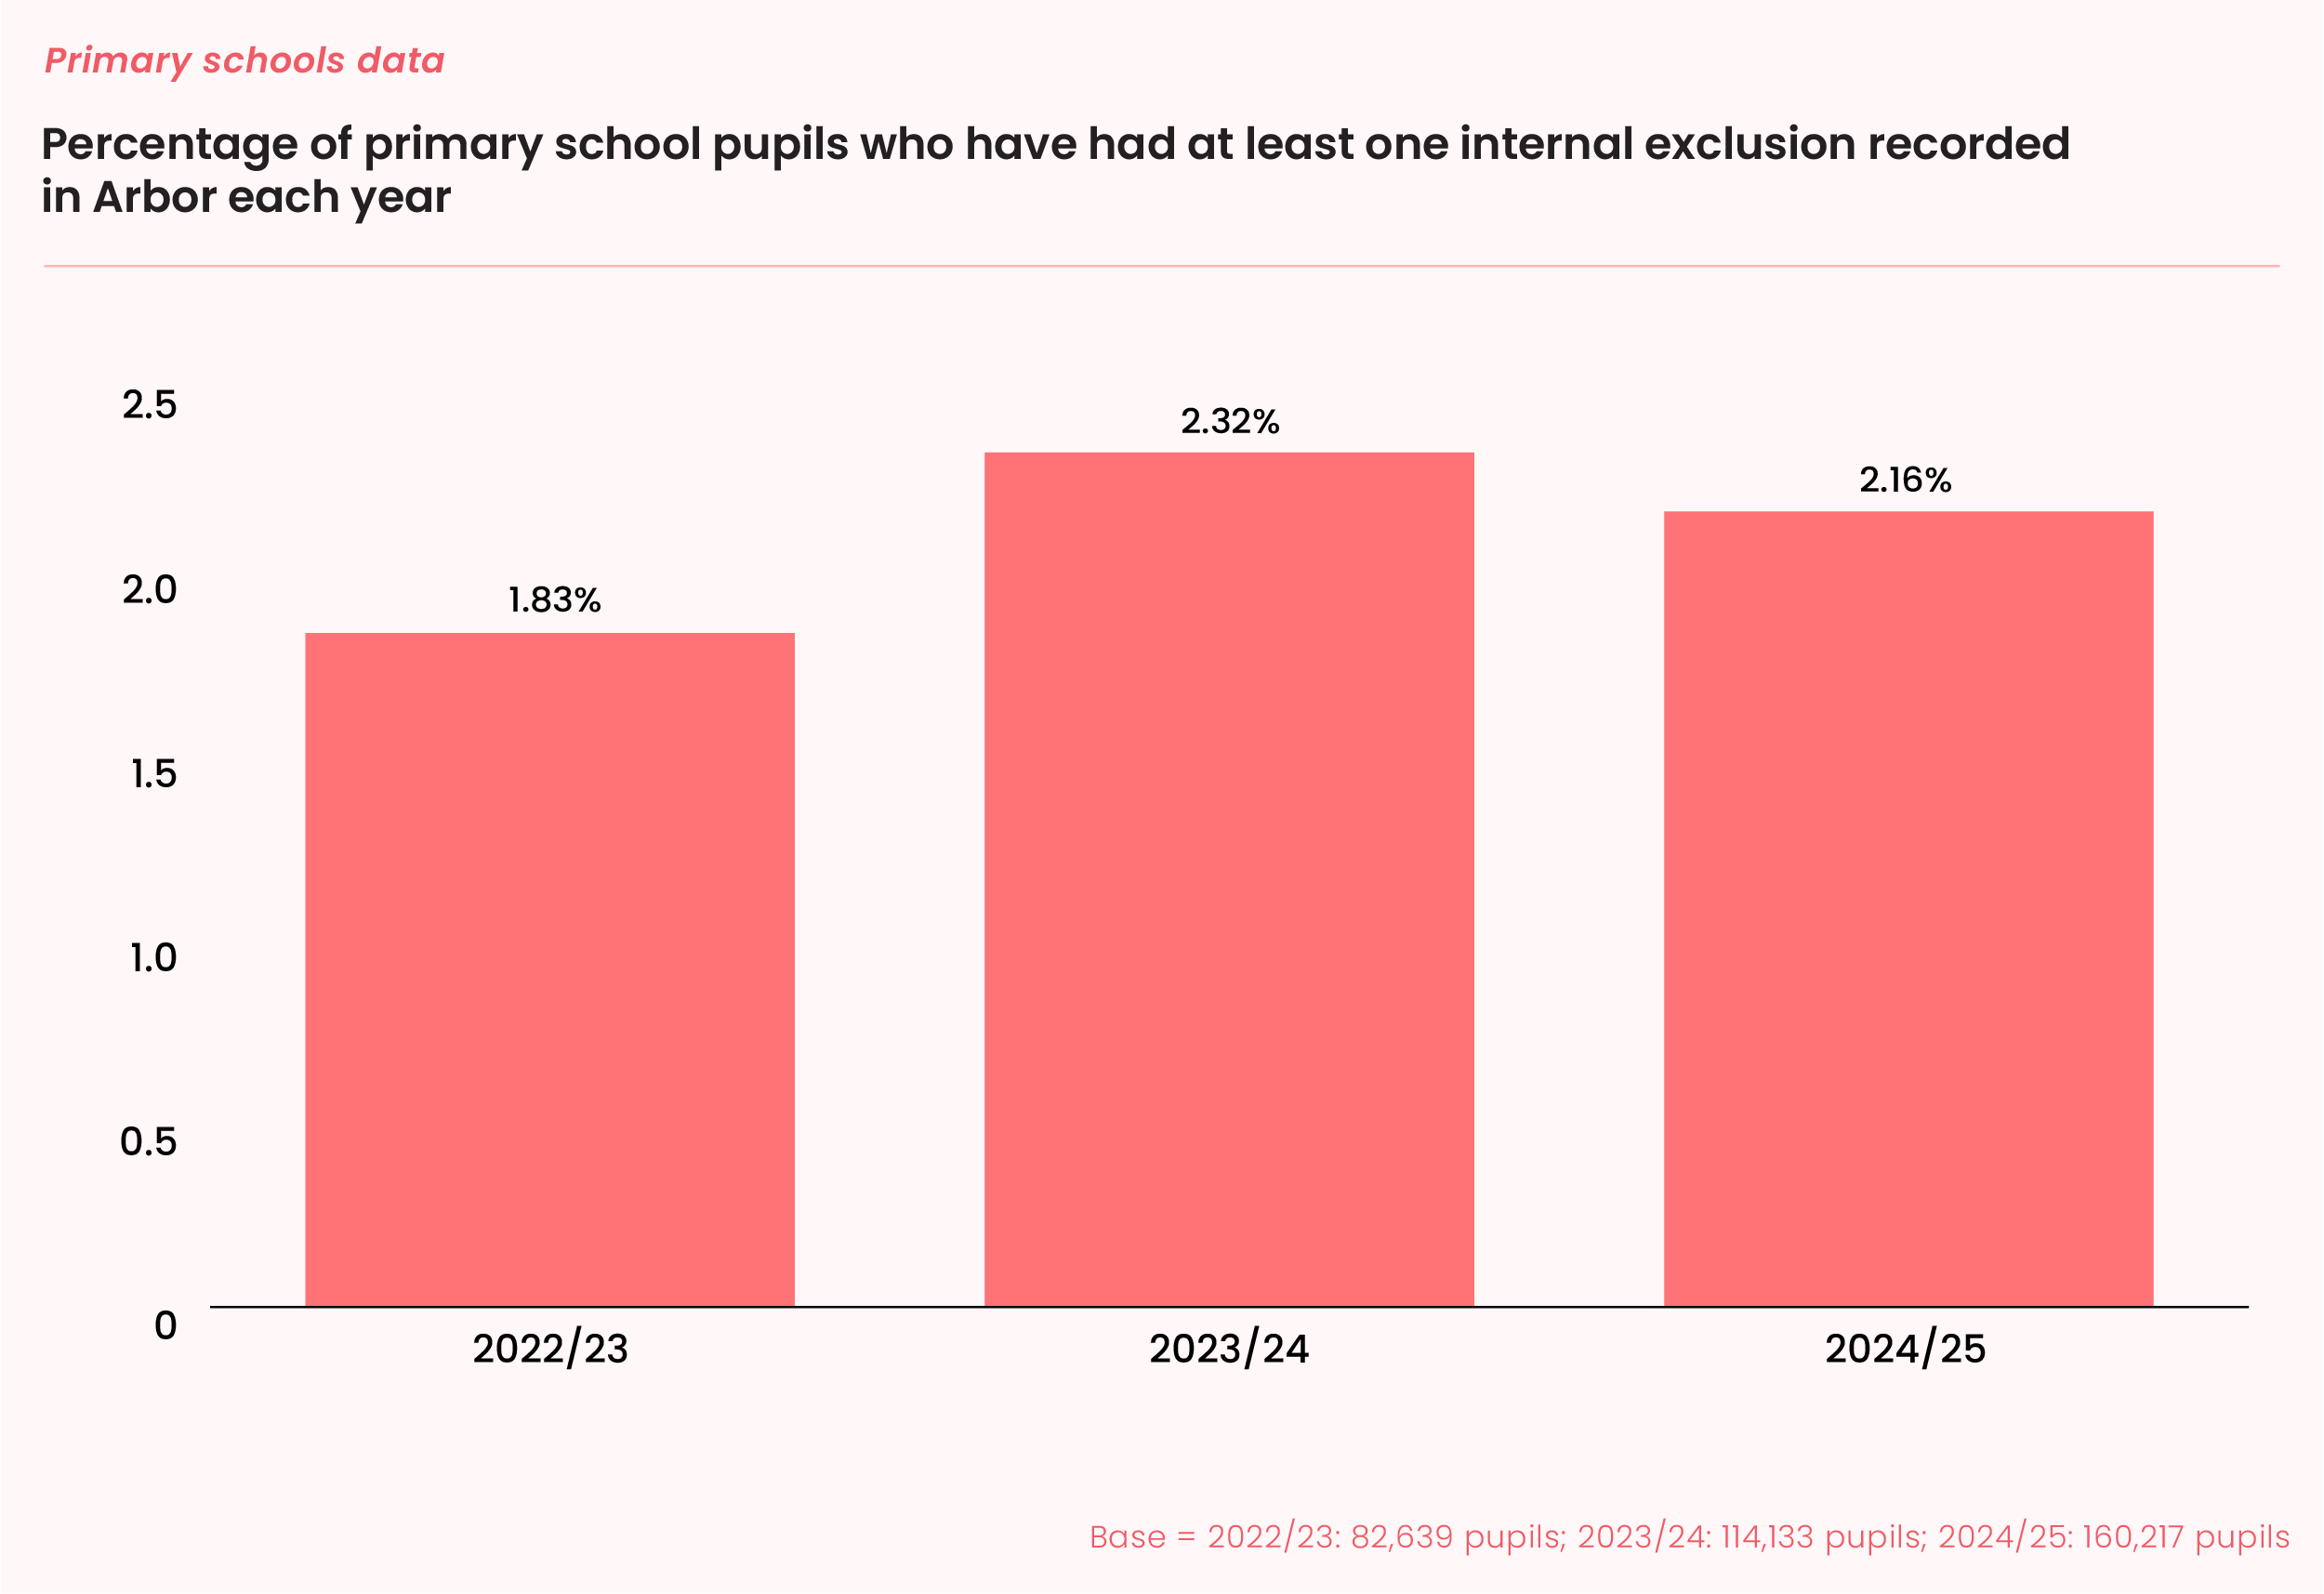
We’re seeing considerably lower percentages than in secondary schools - where we saw a high of 18.69% in 2023/24. Across the years, there’s little variation, although as with secondary pupils, 2023-24 is the highest of the three years we’ve looked at.
Now let’s look at the rates per 100 primary pupils:
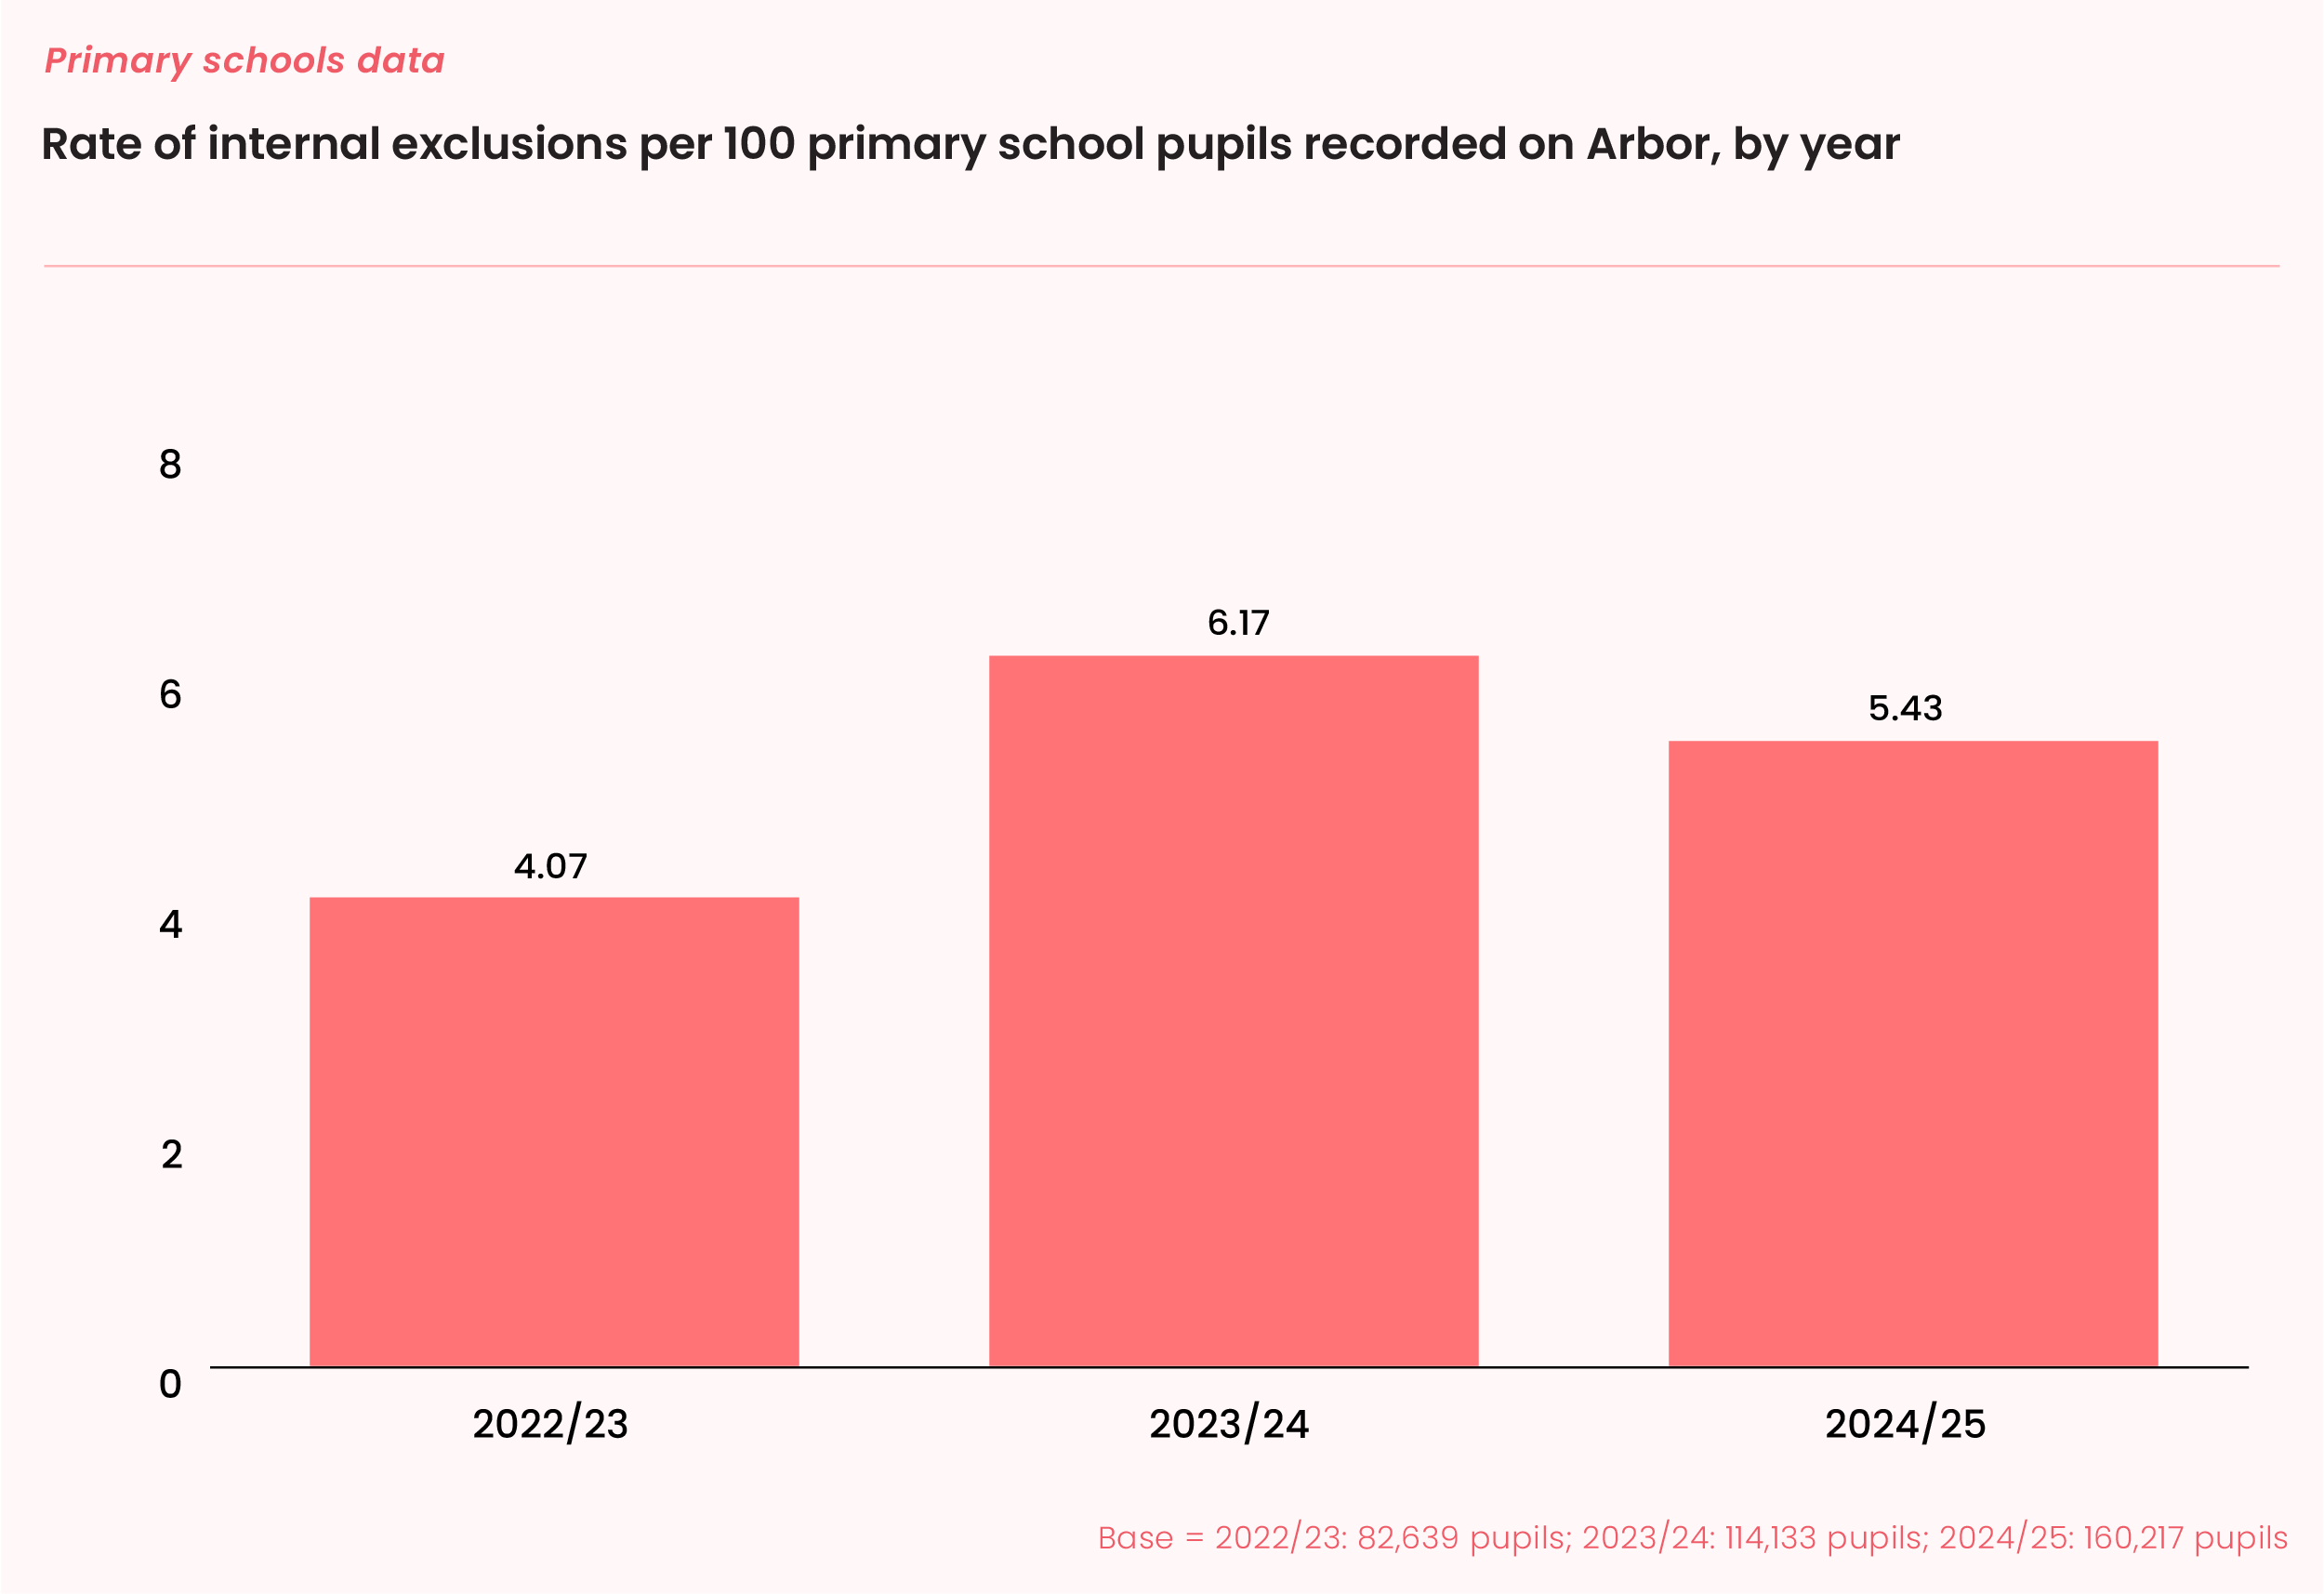
We’re seeing more of a difference between the first and second years studied here - and it’s not clear why, given we see a reduction again in the third year.
Now let’s compare the primary school data by type of school, first looking at the percentage of pupils internally excluded:
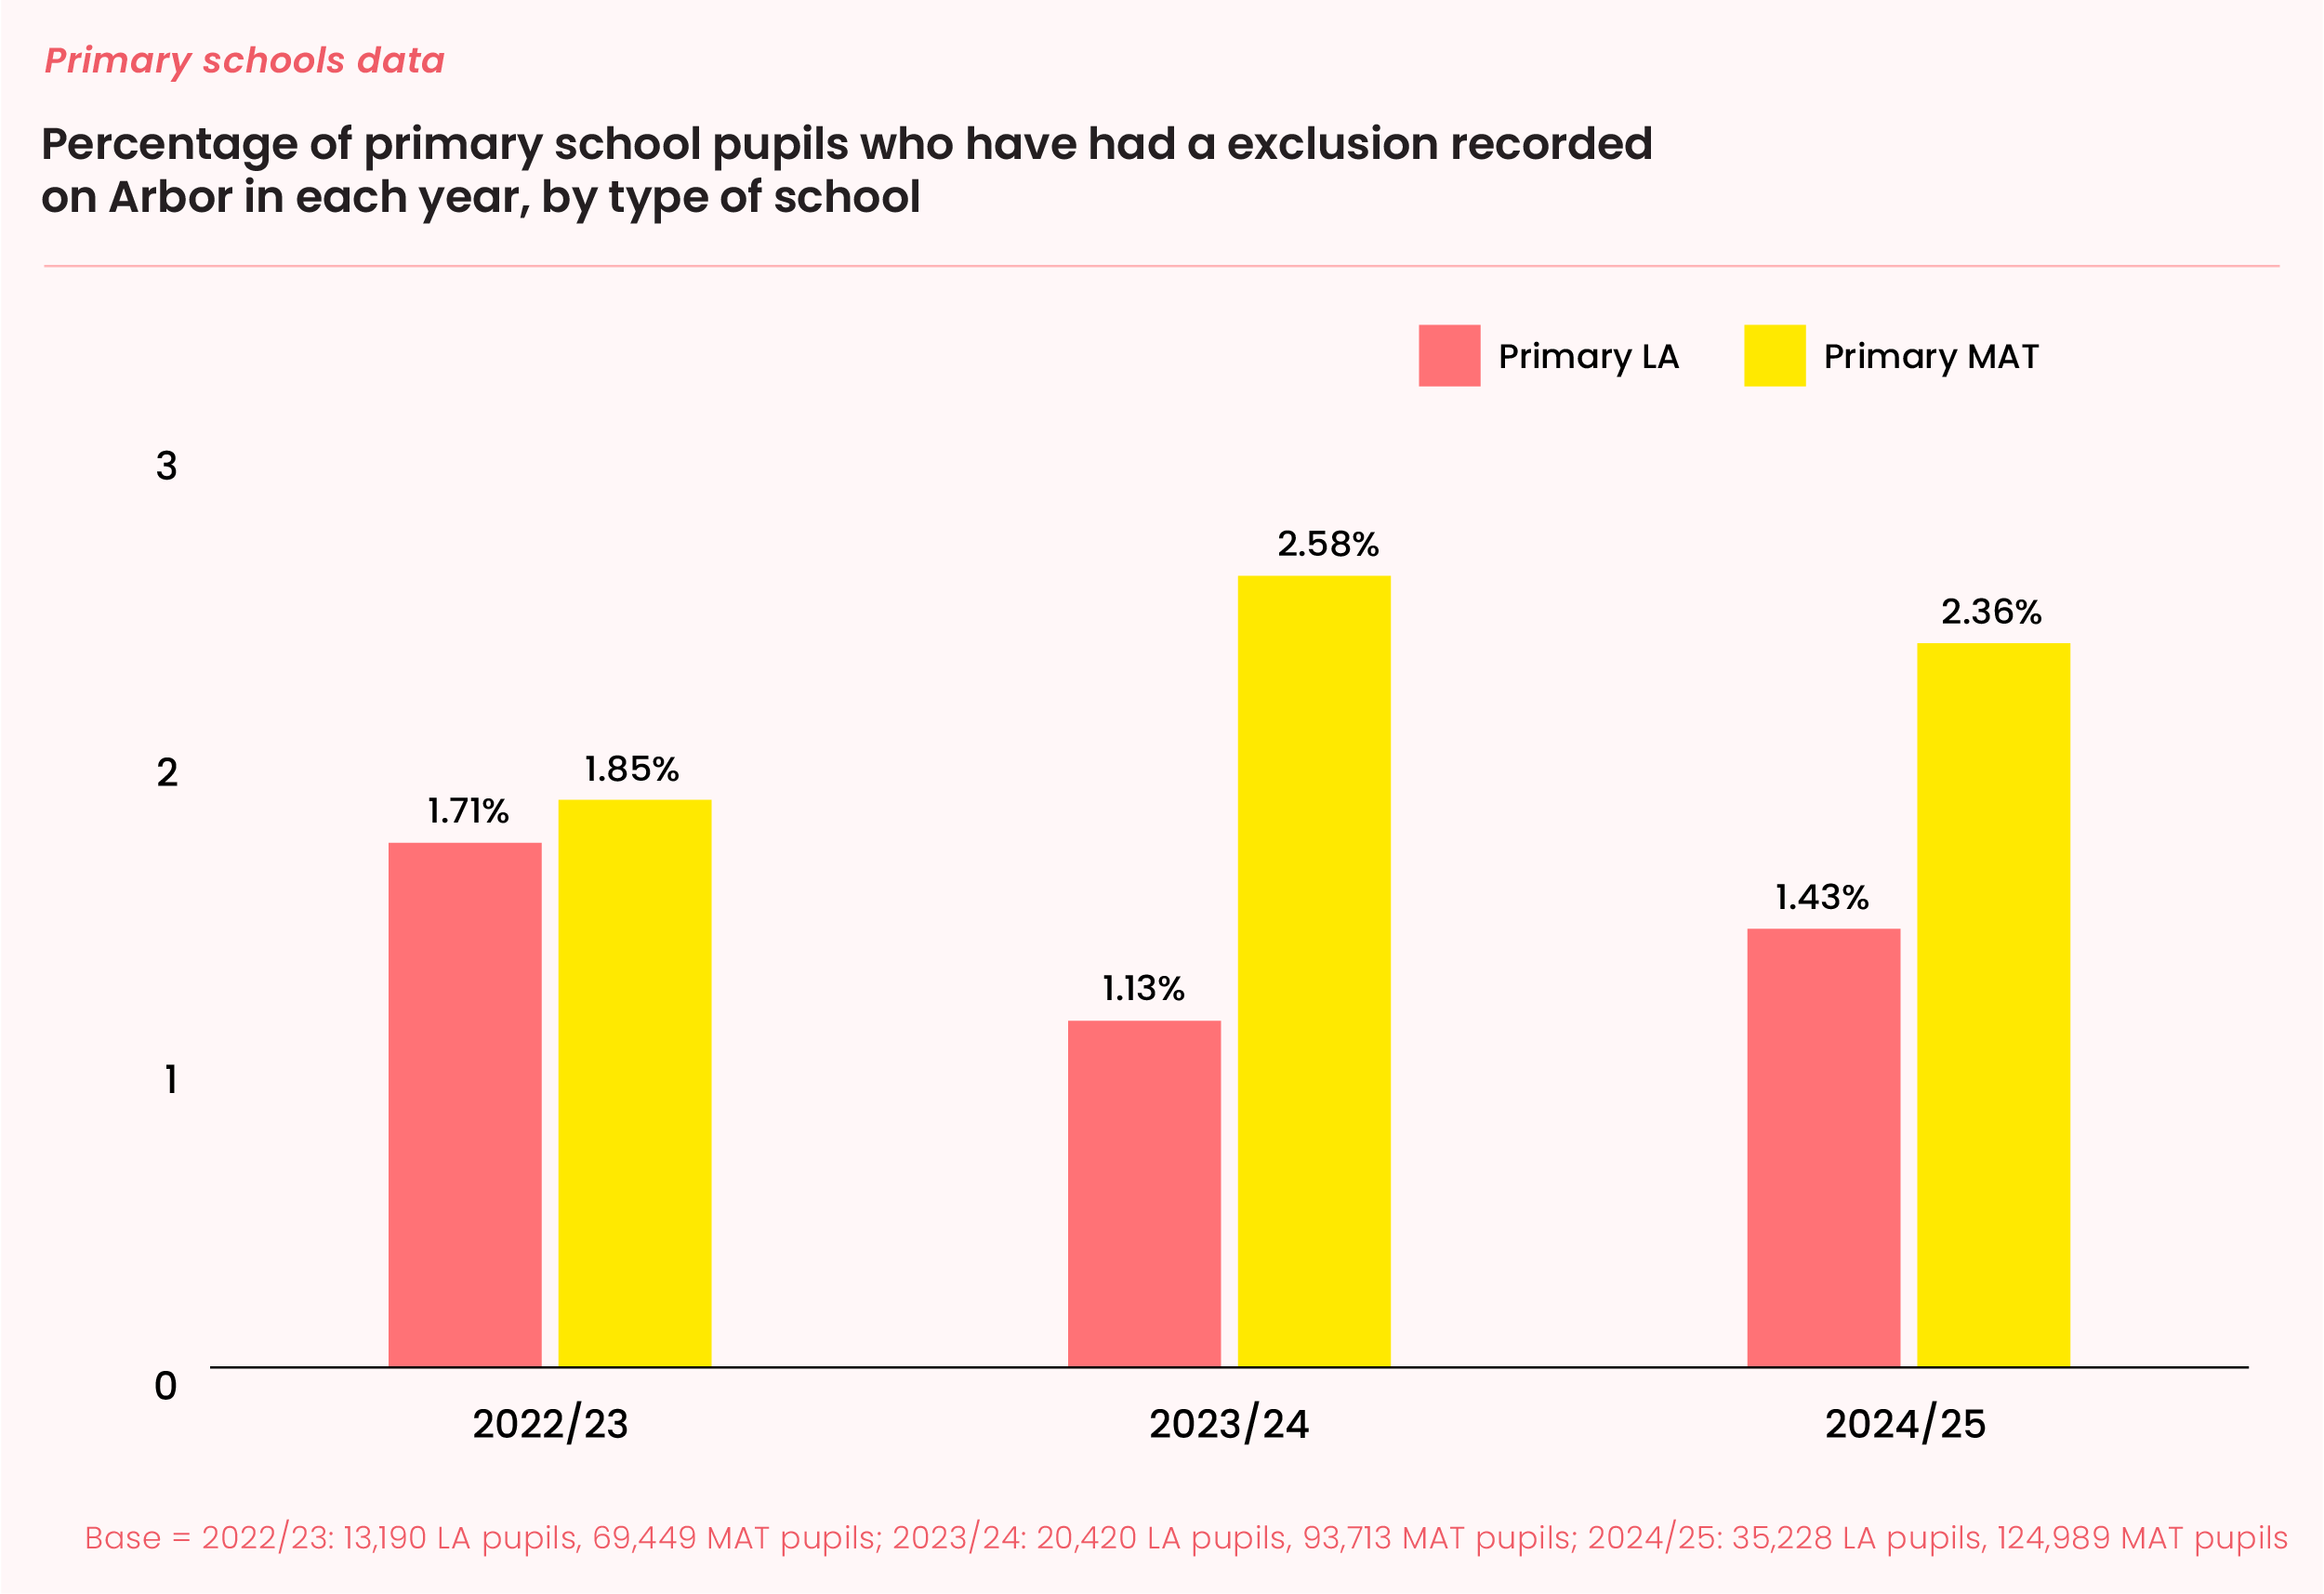
We’re dealing with fairly small percentages here, and year on year, there’s not a huge variation - less than one percentage point by type of school. But it is interesting to note that the inverse was happening in LA schools and MAT schools in 2023/24 - with that year the respective highest and lowest year for exclusions by each type of school, of the 3 years analysed. The difference is arguably not statistically significant enough to draw conclusions from, but it’s worth noting that they haven’t followed the same pattern.
Finally, we can show the difference between LA and MAT primary schools by the rate of exclusions:
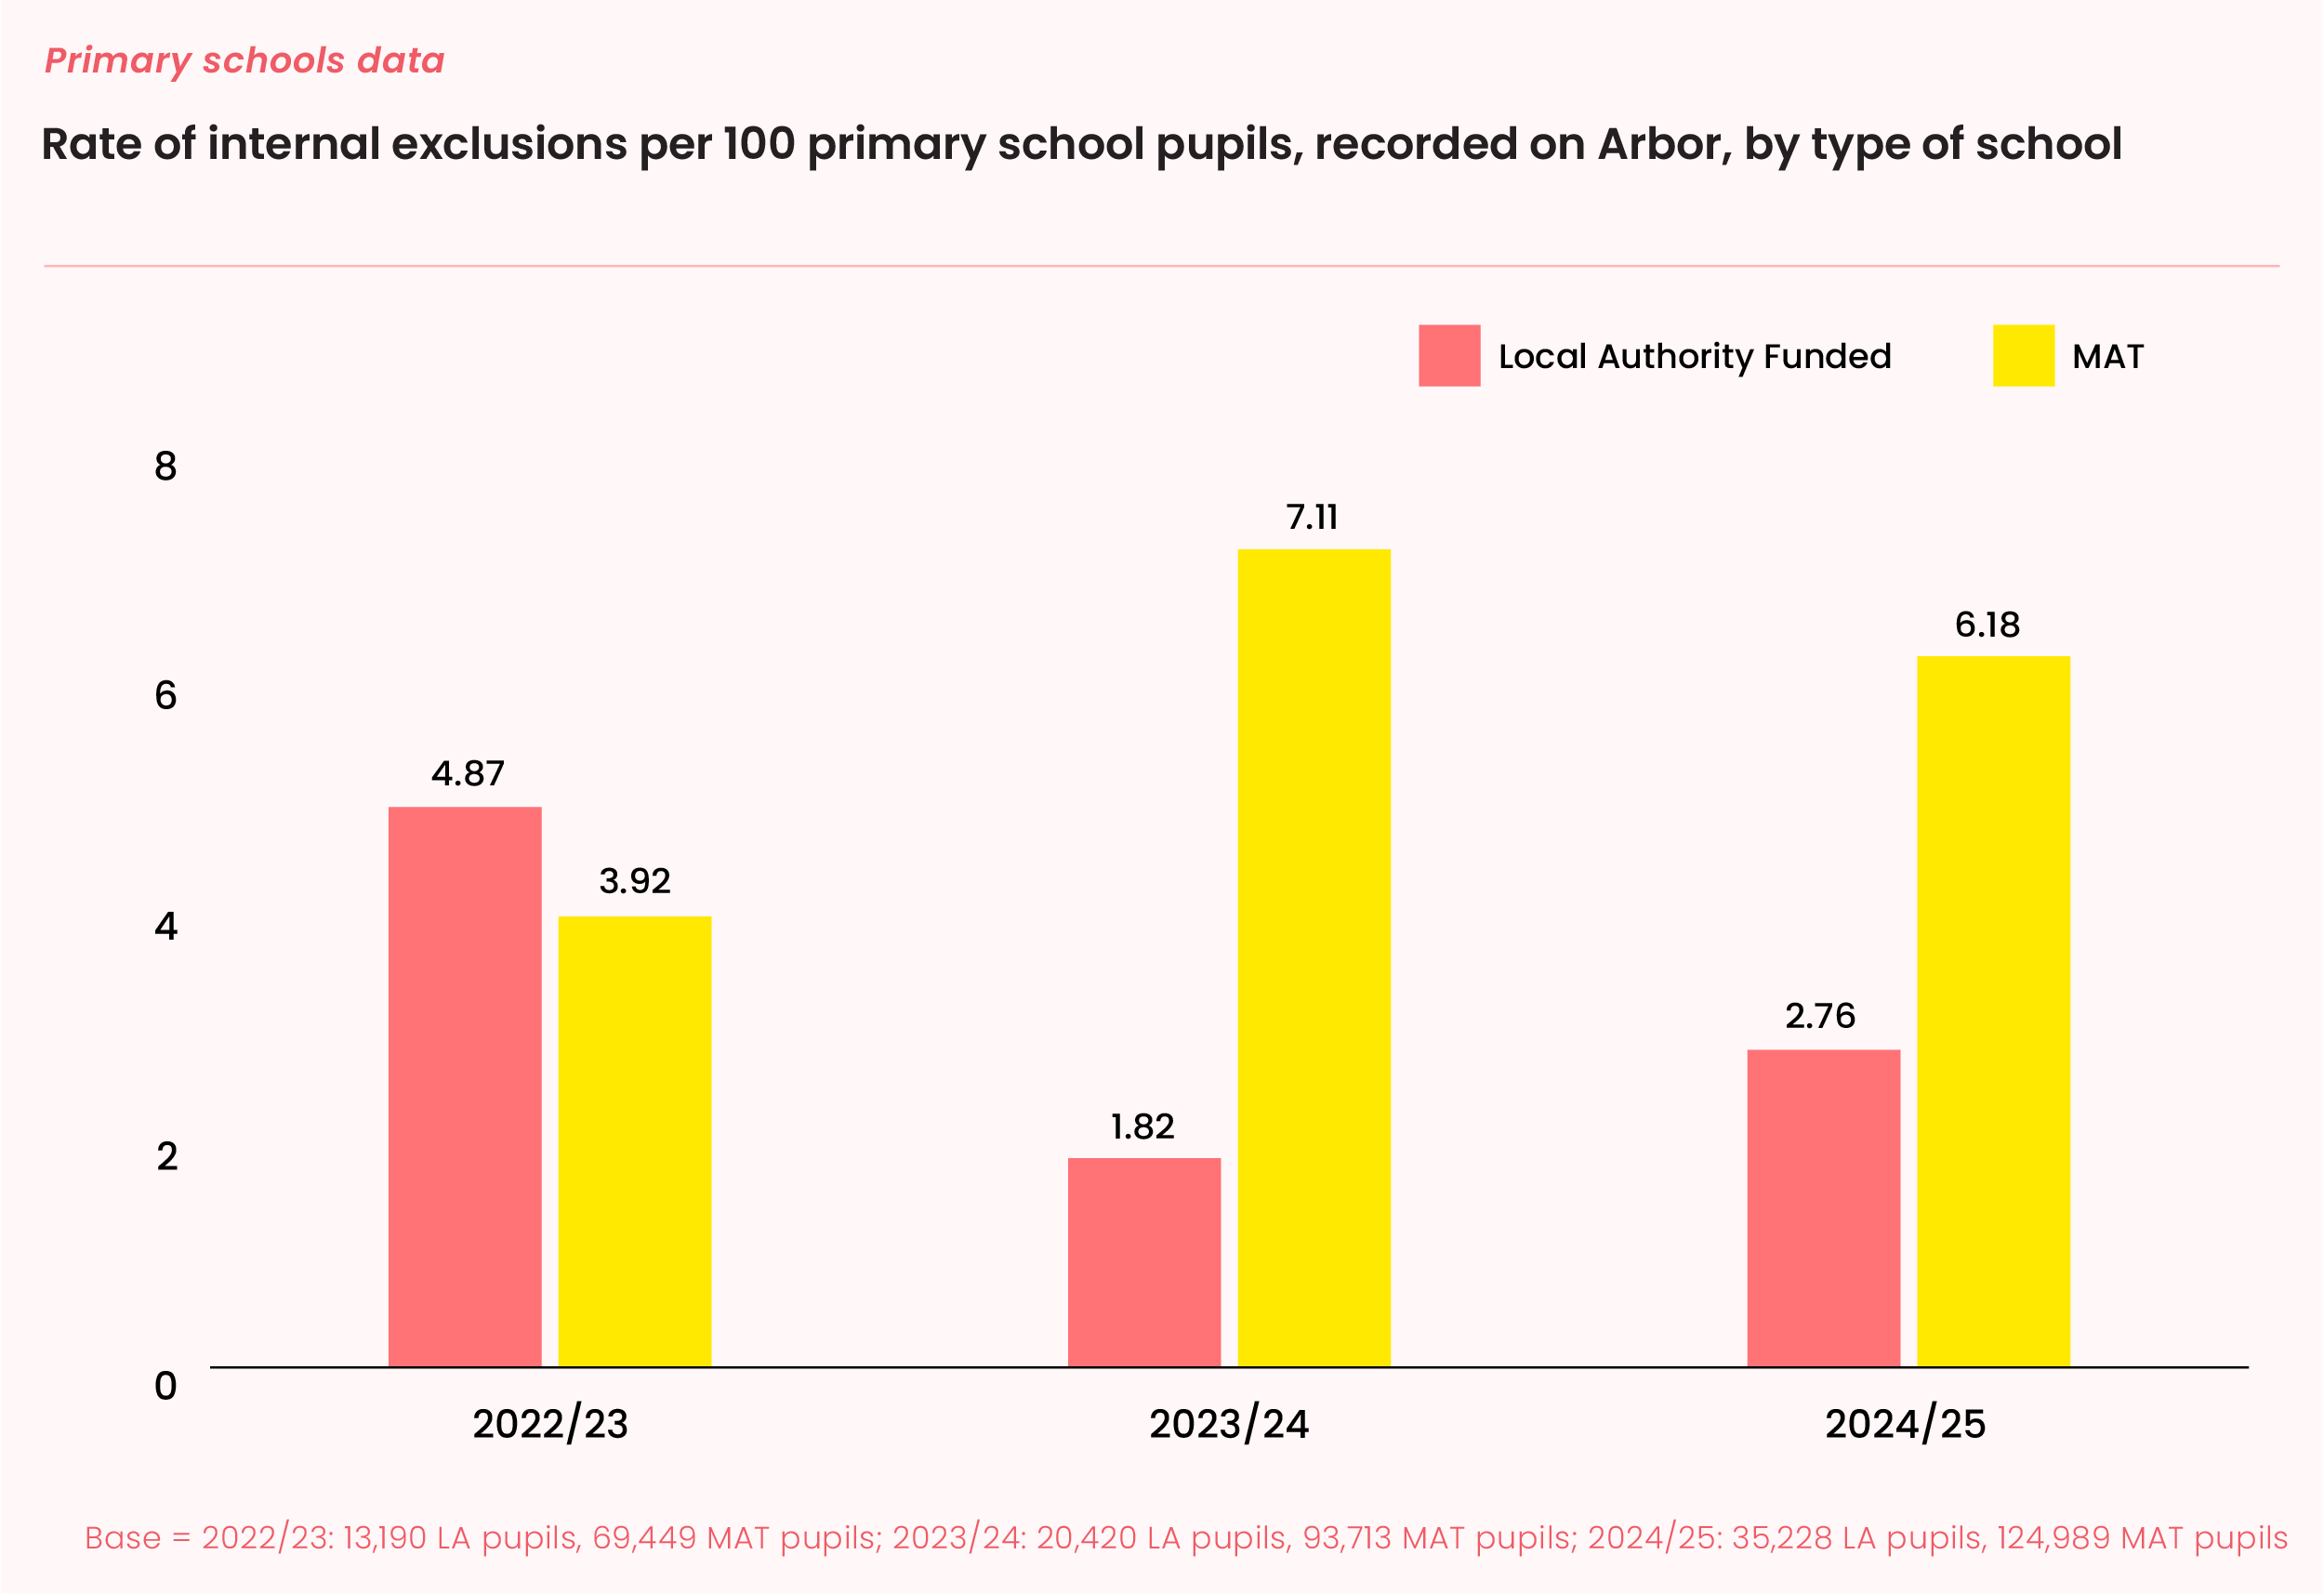
The difference between LA and MAT schools here is particularly stark in 2023/24, with a 5.29 percentage point difference. And overall, as with secondary pupils, we do see a higher percentage of MAT pupils internally excluded - which again, could be to do with a MAT-wide policy on how data is collected as much as anything, so we need to be careful about misinterpreting the data. On the other hand, it’s interesting to note the drop across the years among LA schools and the very stark contrast in 2023/24 between the 1.82 internal exclusions in LA schools and the 7.11 in MAT schools.
Summing up, it’s clear that internal exclusions are a commonly-used sanction in some secondary schools, and that the degree to which this is happening is not meaningfully different across the years studied. In primaries, we see far less of this, and although it’s pretty consistent across the period, there was a jump from 2022/23 to 2023/24, which has since reversed. It’s also fair to say that in both phases, there have been more internal exclusions among schools in MATs than in LA funded schools, although the gap is closing.
And finally, it’s worth seeing the data in the context of this approach to behaviour management potentially supporting more pupils to stay in their own school. Higher internal exclusion rates might have kept that alternative - permanent or temporary external exclusions - down.