What do schools really think about their MIS in 2025?
Annual analysis of 961 MIS users
Management information systems (MIS) play a vital role in schools by supporting a wide range of functions, including pupil data management, attendance and behaviour tracking, reporting, payments and assessment administration.
Each year, The Key runs a survey to gain an understanding of how schools feel about their MIS. This year we've explored the experiences of users of the top 3 providers by market share: Arbor, Bromcom and SIMS. Our objectives were to assess school users’ satisfaction with their current MIS and their perceptions of its effectiveness across a range of metrics. We also aimed to understand potential switching intent and identify key decision-making factors when selecting a new provider.
In total, 961 people answered this latest survey in June and July 2025, including 817 users from the top 3 brands by market share. We weren’t able to achieve a large enough sample size of users of other MIS systems to ensure robust analysis – so we haven’t provided detailed analysis beyond the 3 providers listed above (please see our sample breakdown and survey methodology at the end of this blog post for more detail).
A note for transparency: The Key, which ran this survey, and 3 of the MIS providers used by schools in this survey (Arbor, Integris and ScholarPack), are all part of The Key Group. As a group, The Key Group prioritises listening to schools and their needs, and believes in the ability of best-in-class tech products to transform schools for the better. Our aim is for the findings of this survey to help inform those leading on MIS decisions for their school. In this blog post, we endeavour to present an objective summary of the survey results without additional commentary, to avoid risk of bias.
Generally, how satisfied are schools with their MIS?
When asked to rate their MIS satisfaction on a scale of 1 to 10, responses leaned toward the positive, with 70% of respondents giving a score of 6 or above.
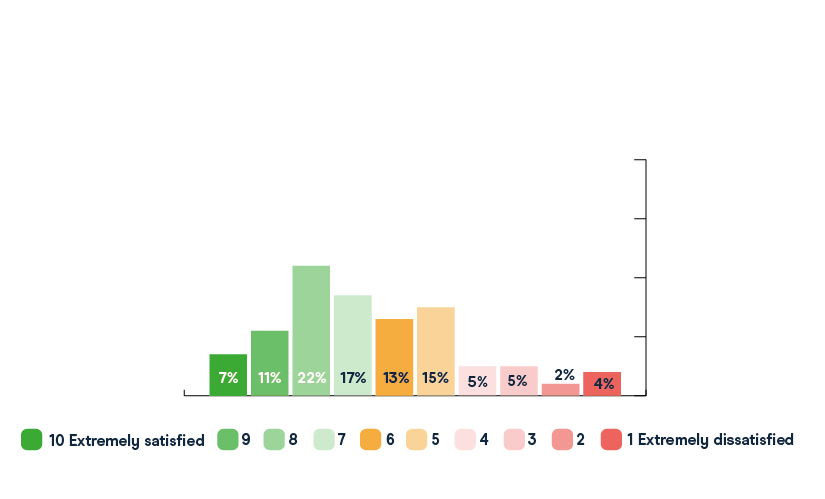
Graph 1: “How satisfied are you with your MIS? Please select a score from 1 to 10, where 1 is ‘Extremely dissatisfied’ and 10 is ‘Extremely satisfied’”, base = 961 respondents
Ratings of 9 or 10 can be considered indicators of ‘extreme satisfaction’, and 18% of respondents selected these scores, down from 24% in 2024. At the other end of the scale, 6% (2024: 4%) reported being ‘extremely dissatisfied’, giving a score of 1 or 2. Overall, the average satisfaction rating has declined slightly, from 7.0 in 2024 to 6.6 in 2025.
Average general MIS satisfaction scores were higher for respondents from primary schools (7.1) than special (6.8), and secondary schools (5.9).
When looking at the top 3 MIS providers by market share (see graph 2 below), Arbor had the highest percentage of respondents rating their MIS as either a 9 or 10 in terms of satisfaction (Arbor: 25%, Bromcom: 15%, SIMS: 11%). Represented as averages, the overall satisfaction scores of survey respondents were 7.3 (2024: 7.7) for Arbor, 6.2 (2024: 6.3) for SIMS, and 6.1 (2024: 6.7) for Bromcom, showing that overall average satisfaction has fallen for all 3 brands since last year.
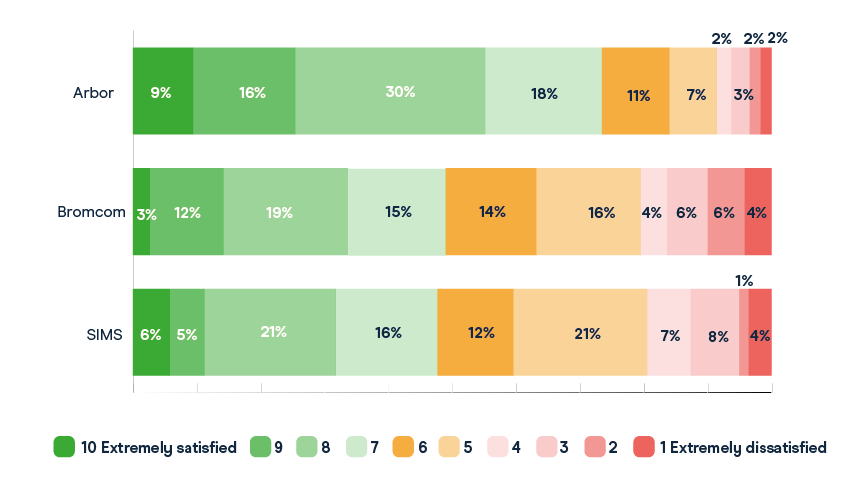
Graph 2: “How satisfied are you with your MIS? Please select a score from 1-10, where 1 is ‘Extremely dissatisfied’ and 10 is ‘Extremely satisfied’”, base = 817 respondents from the top 3 MIS providers by market share
How satisfied were schools with various aspects of their MIS?
Intuitiveness for new users
An MIS underpins many key functions in a school, supporting a wide range of staff – including administrative staff, premises staff, teaching staff and senior leaders. When staff join a new school that uses a different MIS to the one they’re familiar with, getting up to speed quickly is essential to reducing pressure and helping them feel confident in their role. Similarly, when a school changes its MIS provider, a smooth transition is critical. It ensures continuity in day-to-day operations and enables staff to access the data they rely on to perform their roles effectively.
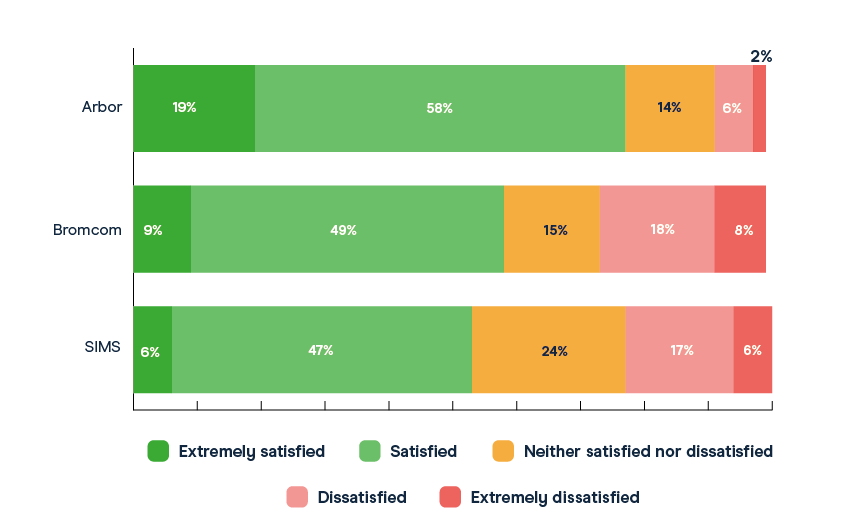
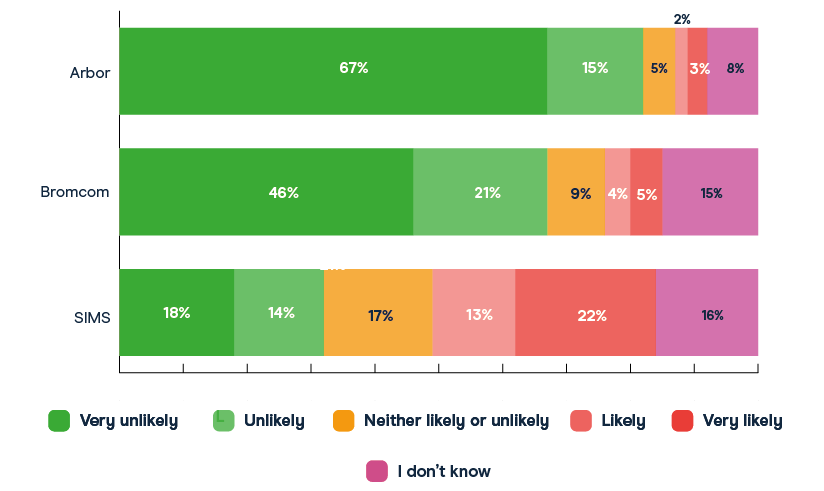
Overall, 47% of all survey respondents said they were either ‘satisfied’ or ‘extremely satisfied’ with how intuitive their MIS was for new users. As shown in graph 3, among the top 3 MIS providers by market share, Arbor had the highest proportion of respondents expressing this view (67%), followed by Bromcom (45%) and SIMS (27%).
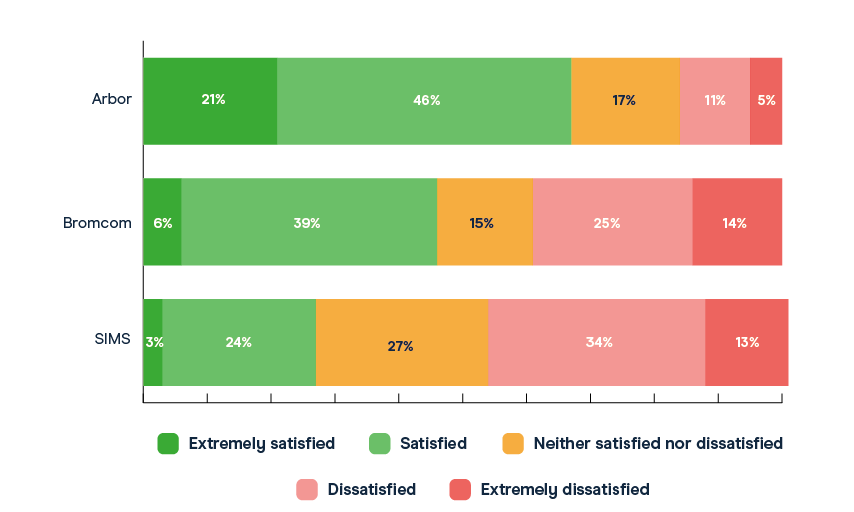
Graph 3: “How satisfied are you with how intuitive the MIS is for new users?”, base = 817 respondents from the top 3 MIS providers by market share
The extent to which the MIS integrates with other systems and software
Whether or not new technology integrates smoothly with existing systems can be the difference between seamless adoption and ongoing frustration. Some 12% of all survey respondents said that ‘integration with other products’ was the most important factor when considering a switch in MIS (see graph 15). We asked all respondents to rate how satisfied they were with their MIS’s integration capabilities, and overall, 59% said they were either ‘satisfied’ or ‘extremely satisfied’.
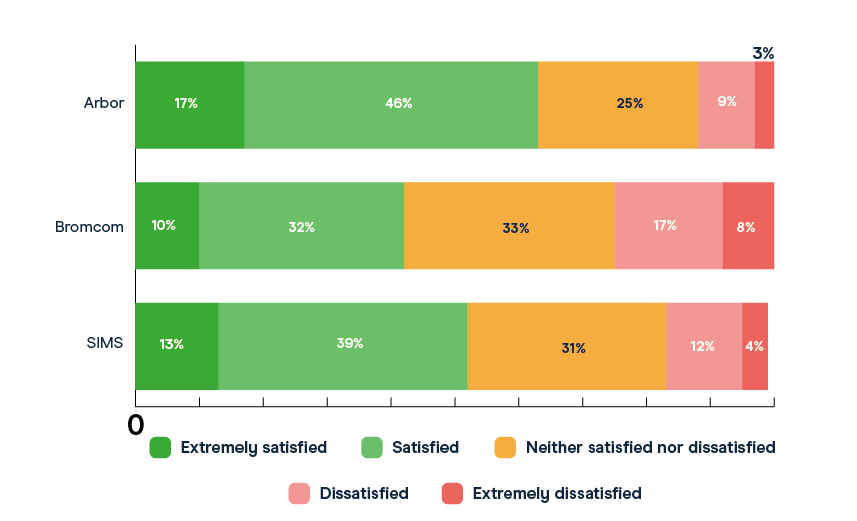
When looking at the top 3 providers by market share (graph 4), Arbor ranked highest in this respect, with 66% of its users saying they were either ‘satisfied’ or ‘extremely satisfied’ with its integration capabilities. This was followed by 57% of SIMS users and 53% of Bromcom users.
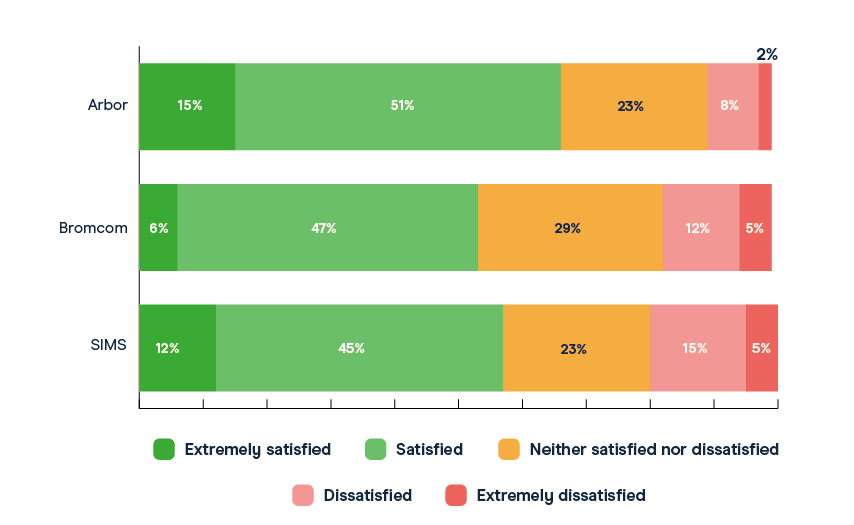
Graph 4: “How satisfied are you with the extent to which the MIS integrates with other systems/software”, base = 817 respondents from the top 3 MIS providers by market share
Functionality of the MIS
Functionality was the most frequently chosen priority when selecting a new MIS, with half of survey respondents naming it as the most important factor (see graph 15). Across the full sample, 63% said they were either ‘satisfied’ or ‘extremely satisfied’ with the functionality of their current MIS. Arbor users were the most positive, with 77% reporting satisfaction at these levels (see graph 5, below). This compares with 58% of Bromcom users and 53% of SIMS users.
Graph 5: “How satisfied are you with the functionality of the MIS”, base = 817 respondents from the top 3 MIS providers by market share
The quality of support received
Schools access day-to-day support for their MIS in a range of ways, whether directly from the provider, via third-party support such as local authority teams or independent organisations, or informally through colleagues and peers. While the quality of support is the most important factor for some schools when considering switching MIS, it’s less likely to be a top priority than other factors including functionality, features and price (see graph 15).
Across all respondents, just over half (54%) are positively satisfied with the quality of support they receive for their MIS. Graph 6 shows that, out of the biggest 3 providers, Arbor had the highest proportion of users who said they were ‘satisfied’ or ‘extremely satisfied’ with the quality of support they received, at 63%. This was followed by SIMS at 52% and Bromcom at 42%.
Graph 6: ““How satisfied are you with the quality of support received?”, base = 817 respondents from the top 3 MIS providers by market share
The extent to which the MIS provides actionable information
For an MIS to be effective, it needs to do more than store data – it should help staff understand and act on it as well. The system should use all the information entered daily to return clear, useful insights. Whether it’s spotting attendance trends, tracking progress, or flagging pupils who need support, a good MIS makes decision-making easier.
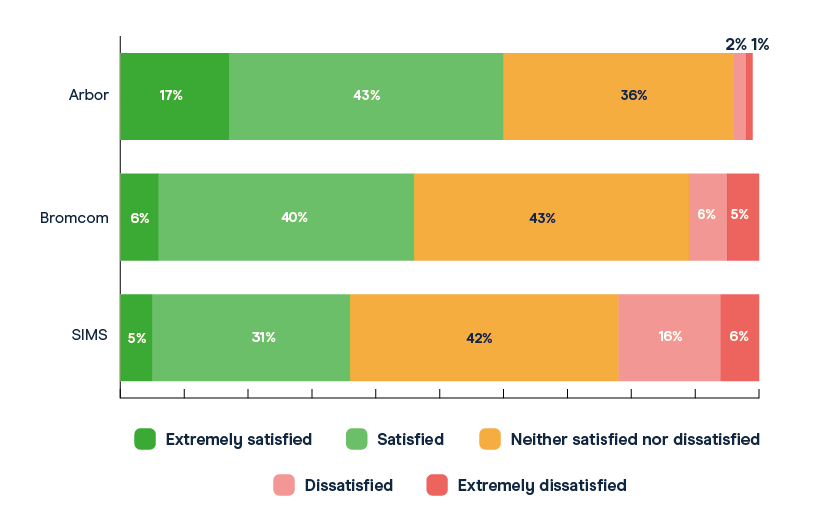
Overall, 56% of respondents said they were either ‘satisfied’ or ‘extremely satisfied’ with how well their MIS provides information they can act on. As shown in graph 7, Arbor users were the most likely to feel this way, with 72% reporting positive satisfaction. This was followed by 53% of Bromcom users and 44% of SIMS users.

Graph 7: ““How satisfied are you with the extent to which the MIS provides actionable information?”, base = 817 respondents from the top 3 MIS providers by market share
The regularity of product updates
Regular product updates help keep an MIS reliable, user-friendly and aligned with schools’ changing needs. As statutory requirements change and priorities evolve, timely updates make sure the system remains effective while fixing issues, refining features and introducing improvements that support staff in their day-to-day work.
Just under half of all respondents (47%) said they were ‘satisfied’ or ‘extremely satisfied’ with how regularly their MIS is updated. Among the 3 largest providers, Arbor had the highest proportion of satisfied users (60%), followed by Bromcom (46%) and SIMS (36%).
Graph 8: ““How satisfied are you with the regularity of product updates.” base = 817 respondents from the top 3 MIS providers by market share
How effective is the MIS at providing various benefits?
Making school staff’s jobs easier is a key goal of any effective MIS. That means helping them save time, access relevant data quickly and work more closely with colleagues. From streamlining admin tasks to enabling collaboration, the right MIS can play a vital role in improving how staff work and the outcomes they achieve.
We asked all respondents how well their MIS delivered on key benefits (see graph 9). Nearly 3 in 10 (29%) said their MIS was ‘not at all’ or ‘not so’ effective at saving them time, while 19% felt it didn’t provide the data they needed to do their job well. A third (33%) said it didn’t support collaboration with colleagues effectively, and around a quarter (26%) felt it wasn’t making their job easier.

Graph 9: “How effective is your MIS at providing you with the following benefits?”, base = 961 respondents
It saves me time
Looking at the ‘time saving’ metric (see graph 10), Arbor users were the most likely out of the 3 biggest MIS providers to rate their MIS as effective: 49% said it was ‘extremely effective’ or ‘very effective’ at saving them time. In comparison, 30% of Bromcom users and 22% of SIMS users gave the same ratings.
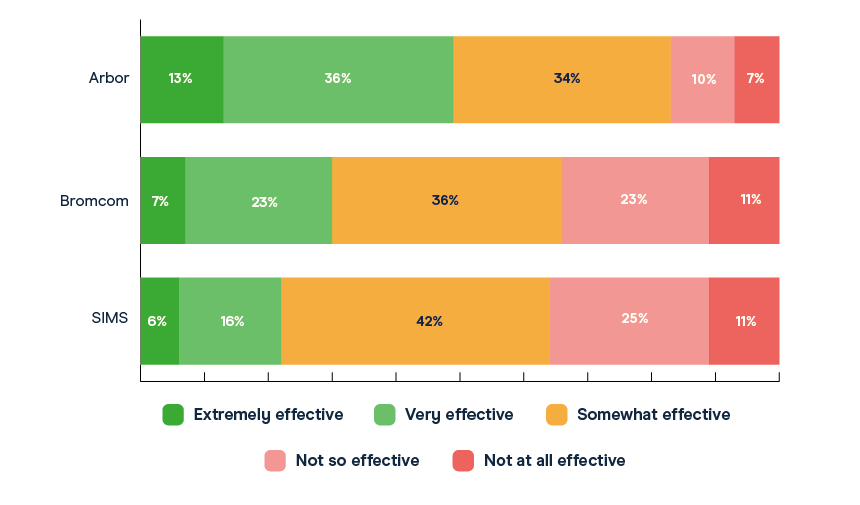
Graph 10: “How effective is your MIS at saving you time?”, base = 817 respondents from the top 3 MIS providers by market share
It gives me the data I need to do my job well
From data managers and office staff who rely on their MIS throughout the day, to teachers who need quick access to information such as pupils’ pastoral records, having the right data at the right time is essential for running a school effectively.
As shown in graph 11, out of the biggest 3 MIS providers, Arbor users were the most likely to rate their MIS as ‘extremely effective’ or ‘very effective’ at providing the data they needed, with 57% expressing this view. This compares with 42% of Bromcom users and 37% of SIMS users.

Graph 11: “How effective is your MIS at giving you the data you need to do your job well?”, base = 817 respondents from the top 3 MIS providers by market share
It helps me to collaborate with colleagues
Schools collect a wide range of data on their pupils, from attendance and behaviour incident data to SEND information, homework completion data, and records of communication with parents and carers. When this data is accessible and easy to interpret, it can support meaningful collaboration between staff. A well-designed MIS plays a vital role in enabling that process.
Graph 12 shows that, among users of the 3 largest MIS providers, respondents who used Arbor were the most likely to rate their MIS as ‘extremely effective’ or ‘very effective’ in supporting collaboration with colleagues, with 39% reporting this. This compares with 27% of Bromcom users and 16% of SIMS users.

Graph 12: “How effective is your MIS at helping you to collaborate with colleagues?’’, base = 817 respondents from the top 3 MIS providers by market share
It makes my job easier
With increasing demands on school staff, it’s essential that core systems like the MIS help ease workload. Staff are likely to value tools that simplify tasks, reduce admin, and support them in focusing on what matters most, which is supporting pupils.
Just over half (51%) of respondents who said they used Arbor felt that their MIS was ‘very’ or ‘extremely’ effective at making their job easier, while 32% of Bromcom users and 25% of SIMS users surveyed shared this sentiment about their MIS.

Graph 13: “How effective is your MIS at making your job easier?”, base = 817 respondents from the top 3 MIS providers by market share
How likely are schools to consider changing their MIS provider in the next 12 months?
Across the total sample, fewer respondents in 2025 said they were ‘likely’ (7%, down from 11% in 2024) or ‘very likely’ (14%, slightly down from 15% in 2024) to consider changing their MIS in the next 12 months. Several respondents reported that they had only recently changed provider, which could partly explain the decline this year in respondents planning to switch MIS. Others stated that their school was tied into a multi-year or MAT-wide contract, which would also act as a barrier to switching.
Overall this year, 21% of all respondents reported that they were considering changing their provider over the next year. Around 1 in 3 (35%) SIMS users reported being ‘likely’ or ‘very likely’ to switch. This compares with 9% of Bromcom users surveyed, and 5% from Arbor, as shown in graph 14.
Graph 14: “How likely are you to consider changing your MIS provider in the next 12 months?”, base = 817 respondents from the top 3 MIS providers by market share
What’s the most important factor for users in looking for a new MIS provider?
This year, we added 2 new answer options for respondents to choose from when asked about the most important factor in selecting a new MIS supplier: ‘range of useful features’ and ‘willingness to innovate’. As noted earlier, the top priority still appears to be functionality. Graph 15 shows that 50% of respondents selected functionality as the most important factor when considering switching providers. Although this remains the most commonly chosen factor, it is lower than last year’s figure of 61%. This drop is likely partly due to the introduction of the new ‘range of useful features’ option, which was the second most selected factor at 17%.
Price continues to fall in importance when choosing a new MIS, dropping from 20% in 2023 to 13% in 2024 and 10% in 2025, confirming a longer-term downward trend. In contrast, the proportion of users who view integration with other products as the most important factor has remained relatively steady, at 10% in 2023, 13% in 2024, and 12% in 2025.
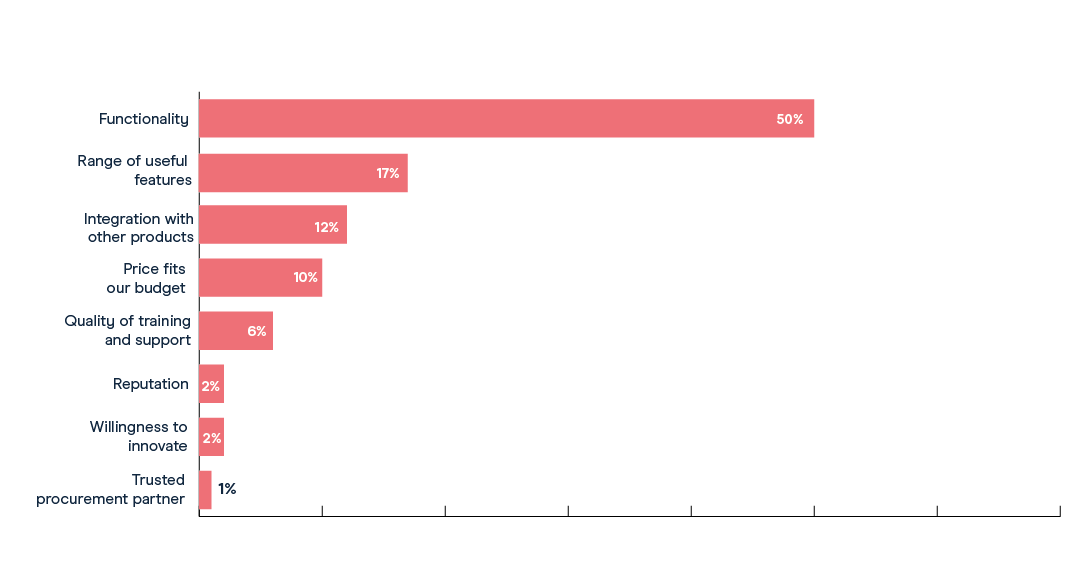
Graph 15: “What is the most important factor when looking for a new MIS supplier?”, base = 937 respondents
A note on our methodology
The Key sent this survey to primary, secondary and special schools in England, via email. The survey ran from 17 June to 7 July 2025, and asked the same questions as previous surveys run by The Key in June/July 2024, June/July 2023, July 2022 and April 2021.
In total, 961 people responded to the survey, including 817 users from the top 3 MIS providers by market share:
350 Arbor users (36% of total respondents)
277 SIMS users (29%)
190 Bromcom users (20%)
According to the school census in May 2025, across the state school sector: Arbor holds 39% market share, SIMS 33%, and Bromcom 15%. While there are some differences between our sample distribution and the sector-wide market share, the survey data is broadly reflective of the relative positioning of these providers in the market.
We also gathered data from schools which were using Integris, SIMS NextGen, ScholarPack, SchoolPod, Pupil Asset, IRIS Ed:gen, iSAMS, Compass, Engage and Juniper Horizons – although these sample sizes were too small to break down. We’ve only included breakdowns by provider where there were at least 100 responses (i.e. for Arbor, SIMS and Bromcom).
Where data was available (noting that we could not classify some respondents due to lack of data), the survey sample included 392 respondents from primary schools, 284 from secondary schools, 104 from special schools, 23 from pupil referral units, and 13 from all-through schools. Some 358 respondents reported working in academies and 372 in maintained schools.
In terms of role, reporting only those with more than 50 respondents, the sample included 208 school business managers or bursars, 161 administrative staff (including PAs), 157 assistant or deputy headteachers, 57 heads of subject, 55 headteachers, and 54 heads of faculty or department.
The data has not been weighted by provider, nor has any adjustment been made to ensure representativeness by phase, role, school type, or region.